Buy our over-priced crap to help keep things running.


| Files | ||||
| File Name | Rating | Downloads | ||
| Advanced PortChecker v1.5 Advanced PortChecker v1.5 A free application that you can use to scan an IP address for open ports. You can scan both TCP and UDP ports (at the same time) to check if they are allowing connections. Scanning information is displayed in real-time meaning you can already use the information as soon as it’s available! Please only scan networks that you have permission to scan. Features Scan TCP ports Scan UDP ports Change connection time-out Real-time scan information Export as HTML Export as CSV Export as plain text Automatic updates Change theme settings Changes Advanced PortChecker 1.5 – Release May 7, 2019 | C#, News Information Advanced PortChecker 1.5 has just been released! This release uses the latest and greatest version of the .NET Framework (4.8). Because of this, Advanced PortChecker 1.5 should work better with multiple monitors and different DPI settings! If you get... Click here to visit the author's website. |
 |
5,555 | Jan 04, 2022 CodeDead 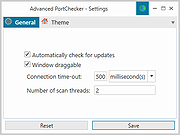 |
|
| Angry IP scanner v3.9.1 Angry IP scanner v3.9.1 A very fast IP address and port scanner. It can scan IP addresses in any range as well as any their ports. It is cross-platform and lightweight. Not requiring any installations, it can be freely copied and used anywhere. Angry IP scanner simply pings each IP address to check if it’s alive, then optionally it is resolving its hostname, determines the MAC address, scans ports, etc. The amount of gathered data about each host can be extended with plugins. It also has additional features, like NetBIOS information (computer name, workgroup name, and currently logged in Windows user), favorite IP address ranges, web server detection, customizable openers, etc. Scanning results can be saved to CSV, TXT, XML or IP-Port list files. With help of plugins, Angry IP Scanner can gather any information about scanned IPs. Anybody who can write Java code is able to write plugins and extend functionality of Angry IP Scanner. In order to increase scanning speed, it uses multithreaded approach: a separate scanning thread is created for each scanned IP address. Changes: v3.9.1: Mac: fix permissions in bundled JRE, so that MAC address scanning would work #384 Linux startup fix if JAVA_HOME has spaces #391 Update MAC vendors This download is for the Windows version. All other download assets are below: MacOS: ipscan-macX86-3.9.1.zip ipscan-macArm64-3.9.1.zip Linux: ipscan_3.9.1_all.deb ipscan_3.9.1_amd64.deb ipscan-3.9.1-1.x86_64.rpm Click here to visit the author's website. |
 |
10,649 | Feb 24, 2023 Anton Keks 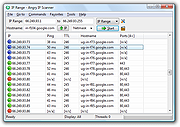 |
|
 |
AppNetworkCounter v1.46 AppNetworkCounter v1.46 AppNetworkCounter is a simple tool for Windows that counts and displays the number of TCP/UDP bytes and packets sent and received by every application on your system. For every application, the following information is displayed: the number of sent and received bytes, number of sent and received packets, number of sent/received IPv4 bytes, and number of sent/received IPv6 bytes. It also displays the version information of the application - Product Name, Product Version, File Description, and Company Name. System Requirements This tool works on any version of Windows, starting from Windows XP and up to Windows 10. Both 32-bit and 64-bit versions of Windows are supported. On Windows Vista and later this tool requires to run as Administrator (elevation). Start Using AppNetworkCounter AppNetworkCounter doesn't require any installation process or additional DLL files. In order to start using it, simply run the executable file - AppNetworkCounter.exe Immediately after running it, the main window displays every application that currently send or receive data on your network. Be aware that the network counters in this tool are not per process but per application, so if you have multiple processes for the same application , AppNetworkCounter merges them into one line. Also, if you close an application and then run it again, AppNetworkCounter will continue the update the network counters of the same application entry. At any time, you can clear the entire list and start with empty window by pressing Ctrl+X (Clear All). You can also reset the network counters of selected items by pressing Ctrl+R (Reset Selected Counters). Translating AppNetworkCounter to other languages In order to translate AppNetworkCounter to other language, follow the instructions below: Run AppNetworkCounter with /savelangfile parameter: AppNetworkCounter.exe /savelangfile A file named AppNetworkCounter_lng.ini will be created in the folder of AppNetworkCounter utility. Open ... |
 |
5,399 | May 29, 2021 Nir Sofer  |
| BluetoothLEView v1.00 BluetoothLEView v1.00 A free tool for Windows 10 and Windows 11 that monitors the activity of Bluetooth Low Energy devices around you. For every detected device, the following information is displayed (if it's available): MAC Address, Name, Signal Strength In dBm (RSSI), Manufacturer ID, Manufacturer Name, Service UUID, first and last time that the device was detected, number of times that the device was detected, and more... System Requirements • This tool works on Windows 10 and Windows 11. Both 32-bit and 64-bit systems are supported. • This tool is just a small standalone .exe file that you can run on any system without installing anything. • Bluetooth dongle that supports Bluetooth Low Energy is needed for this tool. Start Using BluetoothLEView BluetoothLEView doesn't require any installation process or additional DLL files. In order to start using it, simply run the executable file - BluetoothLEView.exe After running it, BluetoothLEView activates the Bluetooth Low Energy scanner and displays every device that it finds. While BluetoothLEView is running you can use the following options: • Stop and start again the Bluetooth Low Energy scanning by using the 'Stop Monitor Bluetooth' (F8 key) and the 'Start Monitor Bluetooth' (F7 key) options. • Use the 'Save All Items' option (Shift+Ctrl+S) to export the displayed devices to csv/tab-delimited/xml/html5/JSON file. You can also use the 'Save Selected Items' option to export only the selected devices. • Select one or more devices, copy the devices list to the clipboard (Ctrl+C) and then paste them to Excel or any other application. • Turn on the 'Put Icon On Tray' option, close the main window, and allow BluetoothLEView to monitor the Bluetooth Low Energy devices in the background. ... |
 |
234 | Jan 22, 2025 Nir Sofer 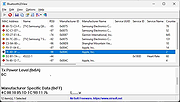 |
|
| BoostPing v1.4.6.0 BoostPing v1.4.6.0 Free tool to improve the responsiveness of online games. Feature Analyzes and sets up the exact network you are active on. Modify the Network throttling index Disables the Nagle algorithm. Usage Press the "Run" button. Changes: BoostPing 1.4.6 (2024/11/03) - Fixed network GUID extraction error on specific environments. - Improved update notification module. Click here to visit the author's website. |
 |
184 | Nov 05, 2024 kilho.net 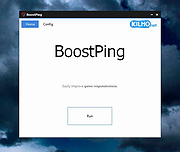 |
|
| Bopup Scanner 2.1.9 Bopup Scanner 2.1.9 This freeware network scanner displays active computers with logged user names (NetBIOS), MAC and IP addresses. Bopup Scanner also recognizes and shows HTTP (Web) servers running on remote computers (TCP ports 80, 8080), quickly detects online computers, allows to browse shared resources of a remote computer and save results to a text file. Advanced users can enter IP range to scan, change a timeout to resolve a remote host and run the program from a command line interface. Portable software Bopup Scanner is a fully portable software. It requires no any setup and installation on a destination computer and can be easily copied to a USB flash drive to move to another PC. Browsing Shared Resources on Remote Computers Bopup Scanner allows to open shared folders on remote computers in Windows Explorer. Right-click on a computer and then select "Browse..." from the pop-up menu. Exploring HTTP Servers Bopup Scanner recognizes HTTP (Web) servers running on remote computers (TCP ports 80, 8080) and shows "Running" label in the "HTTP server" column. Command line support The program can be executed with the command line paramaters in order to specify pre-defined options, such as IP range to scan (start and end IP addresses), a path of the file where to save results. So the scanner can be used in batch files as a tool for an automated monitoring. To see the available command line options run the scanner.exe file with the /? or /h parameters or click More infomation... button in the About dialog. Logging Results Results can be saved to a text file. Just select "Actions\Save list..." and type a file name to save. Changing IP Range to Scan Administrators can enter IP range to scan and timeout to resolve a remote computer. Latest version is 2.1.9 Released on October 29, 2016 Supports Windows® 95/98/Me/NT 4.0/2000/XP/2003/Vista/2008/7/8/2012/10 |
 |
5,705 | Nov 24, 2016 B Labs 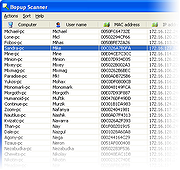 |
|
| cStatus v1.2.7.1 cStatus v1.2.7.1 A free reliable tool to scan and monitor the network. Status started as a software that had two main functions: to monitor and to scan a network. It now can also get information about DNS and whois servers. It can also get Windows Systems informations. Features: A monitoring system with: - ICMP ping monitoring - TCP port monitoring (TCP ping) - Statistical informations - Charting - Simple alarm system - Allows opening a host with several tools: RDP, http, FTP, etc. - Host display filtering system An IP scanner: - MAC information and MAC vender detection - Hostname retrieval with the possiblitly to change DNS query server - Port scanner - Allows to add to the monitoring, one of the IPs that has been detected - Host display filtering system A graphical Trace Route: - Shows the route (hops) through the network between your computer and a specified destination computer. - Calculates and displays the amount of time each hop took - Hostname retrieval with the possiblitly to change DNS query server - Allows to add to the monitoring one of the IPs that has been detected IP subnet calculator: - The IP Subnet Calculator displays subnet network calculations using network class, IP address, subnet mask, number of hosts, first and last usable. IP information: - Gets information about local and public IP addresses DNS information: - An advanced tool to retrieve DNS records from a server. Whois information: - Whois protocol query tool. Designed to obtain domain name information Get Windows Summary: - A tool that gets summary information about several Windows systems. Get Windows info: - A tool that gets detailed information about one or several Windows systems. Click here to visit the author's website. |
 |
5,103 | Jun 02, 2023 Hugo Nabais 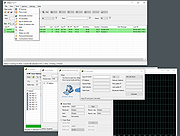 |
|
| CurrPorts v2.77 CurrPorts v2.77 Free tool that monitors opened TCP/IP network ports/connections. CurrPorts is network monitoring software that displays the list of all currently opened TCP/IP and UDP ports on your local computer. For each port in the list, information about the process that opened the port is also displayed, including the process name, full path of the process, version information of the process (product name, file description, and so on), the time that the process was created, and the user that created it. In addition, CurrPorts allows you to close unwanted TCP connections, kill the process that opened the ports, and save the TCP/UDP ports information to HTML file , XML file, or to tab-delimited text file. CurrPorts also automatically mark with pink color suspicious TCP/UDP ports owned by unidentified applications (Applications without version information and icons) Notice: • When the 'Use DNS Cache For Host Names' option is turned on, there is a significant memory leak on every refresh. This memory leak is not caused directly by CurrPorts, but by the DNS cache programming interface of Windows. Currently, I cannot find a workaround for this problem, so if you run CurrPorts for many hours in automatic refresh mode, it's recommended to turn off the 'Use DNS Cache For Host Names' option. • If you want to monitor UDP activity, you should try using the LiveTcpUdpWatch tool. Changes: Version 2.77: Fixed bug: CurrPorts failed to display country/city information for IPv6 addresses System Requirements This utility works perfectly under Windows NT, Windows 2000, Windows XP, Windows Server 2003, Windows Server 2008, Windows Vista, Windows 7, Windows 8, Windows 10 and Windows 11. There is also a separated download of CurrPorts for x64 versions of Windows. If you want to use this utility on Windows NT, you should install psapi.dll in your system32 directory. You can also use this ... |
 |
10,002 | Dec 13, 2023 Nir Sofer 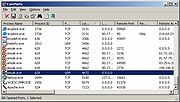 |
|
| DDNS Updater v0.1.3 DDNS Updater v0.1.3 DDNS Updater checks for changes to the external IP address of a Microsoft Windows computer, and updates a dynamic DNS (DDNS) service whenever a change is detected. DDNS Updater has the following features: Compatible with a large number of DDNS services, thanks to a configurable HTTP API Minimizes API calls, e.g. by persistent caching of the IP address and local IP matching Configurable check and update intervals Works with IPv4 and IPv6 (including dual-stack) Able to send email when the detected IP address changes Runs as a Windows service, so that updating occurs even when no-one is logged in Completely free of charge with no adware or spyware No transmission/collection of data Dynamic DNS API Logging Email notification Changes: Version 0.1.3 adds an 'Apply' button so that updates can be forced manually. Timer behavior is changed so that an update is performed sooner when the service starts. Updated OpenSSL so that HTTPS SNI is supported, and %IP% variable is supported in the check URL in addition to the update URL. MD5: 2453eafae7644878abf45cbc098ee813 Installation Download and run the .msi file to install DDNS Updater. After installation, you're presented with the option to configure DDNS Updater. At its simplest, you only need to enter a value for the IPv4 (or IPv6) update URL and save the settings, then DDNS Updater should work. DDNS API External check URL DDNS Updater polls a URL to check whether your external IP address has changed. Any URL which returns your current IP address should work. To do an IPv6 check, enclose the host in square brackets, e.g. http://[checkip.dyndns.org]. If blank, DDNS Updater will cycle through a built-in list of URLs to find one ... |
 |
4,060 | Sep 12, 2019 Wombat Holdings, Inc. 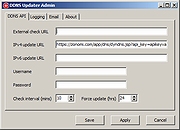 |
|
| DHCPLogView v1.00 DHCPLogView v1.00 Free tool that monitors DHCP requests sent by devices on your network and displays the info. For every device that connects your network the following information is displayed: DHCP Request Time, MAC Address, MAC Address Company, Requested IP Address, Host Name, Vendor Class ID, User Class, PRL Bytes (Parameter Request List), and the operating system of the device (For common versions of Windows and Android) System Requirements Windows XP through Windows 11 Start Using DHCPLogView DHCPLogView doesn't require any installation process or additional DLL files. In order to start using it, simply run the executable file - DHCPLogView.exe Be aware that when you run this tool in the first time, the firewall of Windows operating system will display a warning and you need to allow this tool to access your network. In order to verify that DHCPLogView actually works, you should simply connect one of your devices to your network. If the device is already connected, you have to disconnect it and then connect it again. You should immediately see a new line of the connected device in the main window of DHCPLogView. While DHCPLogView is running you can use the following options: • Turn on the 'Put Icon On Tray' option, close the main window, and allow DHCPLogView to collect information about devices connected to your network. • Turn on also the 'Notification On DHCP Request' option in order to get notification every time that a device is connected to your network. • Select one or more devices, copy the devices list to the clipboard (Ctrl+C) and then paste them to Excel or any other application. • Use the 'Save All Items' option (Shift+Ctrl+S) to export the displayed devices to csv/tab-delimited/xml/html5/JSON file. You can also use the ... |
 |
222 | Feb 25, 2025 Nir Sofer  |
|
| DNS Cache Viewer (DCV) v1.3 DNS Cache Viewer (DCV) v1.3 The purpose of DCV is to allow you to view what Windows has in it's local DNS Cache, and allow you to flush it if you want. Windows XP, Vista, 7, 8 and 10 From the author: "Ever wondered what's in your PC's local DNS cache?" "In troubleshooting network issues, it can be useful to see what is in the PC's DNS cache. The DNS system is the internet system that translates names like "michaelburns.net" into the actual IP Address that your PC needs to contact my server. When your PC needs such a translation, it contacts DNS Servers on the internet (usually the ones belonging to your ISP, or contacts your router which acts as a DNS proxy) to get what IP Address a given name translates into. In order to save time for servers/websites that your PC contacts frequently, the PC locally stores a table of names, IP Addresses, expiration times for the info, and other characteristics about the DNS data in the cache. That local table is your PC's DNS Cache. The next time your PC needs to go to a specific website again (say, michaelburns.net), your PC first looks to see if that name & IP Address translation already exists in it's cache. If it does, it saves time by using the info in it's cache rather than do a query to a DNS server (which takes time). There are lots of reasons why the info in the cache may be invalid, ranging from large websites like Google have many IP addresses for the same web name, and they are dynamically allocated to even out traffic flow and so the cache info expires quickly, to nefarious reasons like Adware or Malware is trying to misdirect your PC for their own purposes. If the PC looks ... |
 |
3,002 | Mar 05, 2021 Michael J. Burns  |
|
| DNSLookupView v1.01 DNSLookupView v1.01 A DNS tracing tool for Windows 10 that allows you to view the details of every DNS query sent through the DNS Client service of Windows. For every DNS query, the following information is displayed: Host Name, Query Type (A, AAAA, and so on), Query Status (Error or succeeded), Query Result, Query Timestamp, ID and name of the process that requested the DNS lookup. System Requirements This tool works only on Windows 10 and Windows 8.1. Both 32-bit and 64-bit systems are supported. This tool doesn't work on older versions of Windows, because the operating system doesn't support the DNS tracing. How it works ? This tool uses the event tracing of Windows operating system with the 'Microsoft-Windows-DNS-Client' provider ( 1C95126E-7EEA-49A9-A3FE-A378B03DDB4D ). The captured event ID is 3008, which contains the information about every DNS query handled by the DNS Client service of Windows. Changes: Version 1.01: Added option to choose another font (name and size) to display in the main window. Fixed problem with the 'Choose Columns' window in high DPI mode. Start Using DNSLookupView DNSLookupView doesn't require any installation process or additional DLL files. In order to start using it, simply run the executable file - DNSLookupView.exe After running DNSLookupView, the main window is displayed, and you can press the 'Start DNS Tracing' toolbar button (or simply press the F5 key) to start capturing the DNS queries on your system. When you want to stop capturing the DNS queries, you can simply press the F6 key or the 'Stop DNS Tracing' toolbar button. You can select one or more DNS queries (or select all of them by pressing Ctrl+A) and then export them to comma-delimited/tab-delimited/html/xml/JSON file by using the 'Save Selected Items' option (Ctrl+S), or you can ... |
 |
2,511 | Oct 21, 2021 Nir Sofer  |
|
| DNSQuerySniffer v1.96 DNSQuerySniffer v1.96 A free network sniffer utility that shows the DNS queries sent on your system. For every DNS query, the following information is displayed: Host Name, Port Number, Query ID, Request Type (A, AAAA, NS, MX, and so on), Request Time, Response Time, Duration, Response Code, Number of records, and the content of the returned DNS records. You can easily export the DNS queries information to csv/tab-delimited/xml/html file, or copy the DNS queries to the clipboard, and then paste them into Excel or other spreadsheet application. System Requirements: This utility works on any version of Windows, starting from Windows 2000, and up to Windows 11. Both 32-bit and 64-bit systems are supported. On some systems, capturing packets with the 'Raw Sockets' method may not work properly, and thus you'll need to install the WinPcap capture driver or the Network Monitor driver. Even if the 'Raw Sockets' method works properly on your system, it's recommended to install the WinPcap capture driver or Microsoft Network Monitor driver (version 3.4 or later) in order to get more accurate date/time information ('Request Time', 'Response Time', and 'Duration' columns) In order to use the Network Monitor driver on 64-bit systems, you have to download the x64 version of DNSQuerySniffer. Changes: v1.96 Fixed to detect HTTPS request type (65). Start Using DNSQuerySniffer Except of a capture driver that you may need to install, DNSQuerySniffer doesn't require any installation process or additional dll files. In order to start using it, simply run the executable file - DNSQuerySniffer.exe After running DNSQuerySniffer in the first time, the 'Capture Options' window appears on the screen, and you're requested to choose the capture method and the desired network adapter. In the next time that you use DNSQuerySniffer, it'll automatically start ... |
 |
9,340 | Jun 24, 2025 Nir Sofer 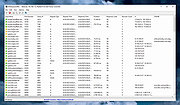 |
|
| EtherApe v0.9.19 EtherApe v0.9.19 EtherApe is a graphical network monitor for Linux modeled after etherman. Featuring link layer, IP and TCP modes, it displays network activity graphically. Hosts and links change in size with traffic. Color coded protocols display. It supports Ethernet, FDDI, Token Ring, ISDN, PPP, SLIP and WLAN devices, plus several encapsulation formats. It can filter traffic to be shown, and can read packets from a file as well as live from the network. Node statistics can be exported. As of version 0.9.14, EtherApe fas these features, in no particular order: Network traffic is displayed graphically. The more "talkative" a node is, the bigger its representation. Node and link color shows the most used protocol. User may select what level of the protocol stack to concentrate on. You may either look at traffic within your network, end to end IP, or even port to port TCP. Data can be captured "off the wire" from a live network connection, or read from a tcpdump capture file. Live data can be read from ethernet, FDDI, PPP, SLIP and WLAN interfaces, plus several other incapsulated formats (e.g. Linux cooked, PPI). The following frame and packet types are currently supported: ETH_II, 802.2, 803.3, IP, IPv6, ARP, X25L3, REVARP, ATALK, AARP, IPX, VINES, TRAIN, LOOP, VLAN, ICMP, IGMP, GGP, IPIP, TCP, EGP, PUP, UDP, IDP, TP, ROUTING, RSVP, GRE, ESP, AH, EON, VINES, EIGRP, OSPF, ENCAP, PIM, IPCOMP, VRRP; and most TCP and UDP services, like TELNET, FTP, HTTP, POP3, NNTP, NETBIOS, IRC, DOMAIN, SNMP, etc. Data display can be refined using a network filter using pcap syntax. Display averaging and node persistence times are fully configurable. ... |
 |
2,846 | Mar 11, 2021 EtherApe Devs 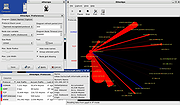 |
|
| eToolz v4.5.2 eToolz v4.5.2 eToolz includes some of the most important network tools like DNS Lookup, Ping, TraceRoute and Whois. The most important features: Includes some of the most important network tools like DNS Lookup, Ping, TraceRoute and Whois. The most importatnt DNS entries can be shown (A, PTR, NS, MX, TXT und SOA). Automatic or manual query for Whois server incl. automatic redirection. Mail addresses can be checked for validity. Mail headers can be broken down and the received lines can be checked for plausibility. Query and update the system time using various time servers. Query the external IP address and the external host name through Web services. Display the installed and available network adapters and their corresponding IPv4 statistics. Display the HTTP headers for a URL. eToolz supports internationalized domain names. eToolz is portable and can be used on USB devices. Languages: English, German, French, Greek, Italian, Japanese, Korean, Norwegian, Polish, Portuguese, Portuguese (brasil.), Russian, Swedish Required: Microsoft .NET Framework 4 Changes: Version 4.5.2 Fixed HTTP header: Some texts in the output could not be translated. Click here to visit the author's website. |
 |
5,540 | Nov 18, 2020 Werner Rumpeltesz 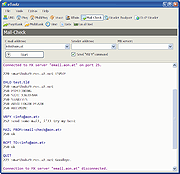 |
|
| Get My IP v0.11.1 Get My IP v0.11.1 Free tool to display IP and geolocation information. Features • Shows internal and external IP addresses. • Shows geolocation data for the external IP address. • Choose from multiple geolocation data providers. • Shows all internal IP addresses if there are more than one. • Optionally write external IP information to a log file. • Opens the default browser showing a map with the latitude and longitude found in the geolocation information. • Choose between Google Maps, Bing Maps, or LatLong.net to display map. • Optionally shows IPv6 addresses for internal addresses. • Copy data to the clipboard in tab delimited format. Perfect for pasting into Excel. • Save data to a tab delimited text file. • Select light or dark, or darker theme and one of 20 accent colors. • Minimize to tray. • Customize the details shown in the tray icon tooltip. • Optional automatic refresh and notification when external IP address changes. Changes: v0.11.1 09-29-24 New: Double-clicking on the icon in the system tray will now open the main window. #99 Fixed: Incorrectly named string resource. Updated: Korean language updates. Thanks @VenusGirl. Updated: Dutch language updates. Thanks @CMTriX. Updated: Bumped CommunityToolkit.Mvvm to version 8.3.2. Updated: Bumped NLog to version 5.3.4. Updated: Bumped Vanara.PInvoke.User32 to version 4.0.4. Updated: Tidied up some files. This download is for the Windows 64bit portable version (very bottom of page). All other download assets ... |
 |
1,444 | Sep 20, 2024 Tim Kennedy 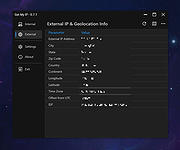 |
|
| Get my IP v1.1 Get my IP v1.1 Very simple program that retrieves and displays your internal and external IP address. You can set it to start, retrieve your IP, place it to clipboard and automatically shutdown itself. This app is completely portable and can be ran from a USB stick, network folder or cloud folder. How to use it When "copy external IP" and "automatically shutdown" options are active, the program will automatically place your external IP to clipboard then shutdown itself. All you have to do is to paste your IP from clipboard into the desired place. |
 |
4,055 | Oct 08, 2019 Cubic Design 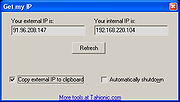 |
|
| HELIUM PINGer v0.97 HELIUM PINGer v0.97 A fast, lightweight, portable PING tool. Network checking by PING services (one time or nonstop) managing with IP list (creating and storing) multithreads technology for pinging DNS and Reverse DNS support single TraceRoute share open, www open |
 |
5,495 | Mar 24, 2019 HELIUM PINGer 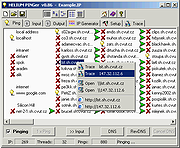 |
|
| Homedale v2.14 Homedale v2.14 Wi-Fi / WLAN Monitor With Homedale you can scan for Wi-Fi / WLAN Access Points and monitor their signal strength. The details windows shows all ‘Information elements’ and their decoded data. Use the detected access points with Google Geolocation, Mozilla Location Service and Open WLAN Map Service to locate yourself. It works with 802.11a/b/g/n/ac wireless networks in the 2.4 GHz and 5 GHz frequency bands using 20, 40, 80 and 160 MHz width channels. Details See an overview of all available access points with their signal strength, security [WEP/WPA/WPA2], network name (SSID), BSSID, vendor based on MAC address, channel, supported data rates and much more. Details from information elements (IE) advertised by the access points are parsed and shown. Signal Strength You can also monitor the signal strength of selected access points in a graph over the time. With a right mouse click, you can start logging to a text file and create a screenshot. Frequency Usage See the usage of all Wi-Fi channels and find the optimal channel for your access point. Connect Make a right mouse click to connect and disconnect from a Wi-Fi / WLAN access point. The blue icon shows the currently connected access point. Changes: Windows v2.14 New: Channel Utilisation Rssi graph color inverted macOS v1.17 New: Crash prevented Supported Languages: English French German Greek Italian Korean Norwegian Polish Portuguese Russian Simplified Chinese Slovenian Swedish Traditional Chinese Ukrainian Command line options: /n <0/1/2> 0: Do not use ndis [default for >=Vista], 1: Use ndis [default for <=XP], 2: Use ndis exclusively /r <x> Refresh after x milli seconds /s <ssid1,…> Log only specified ssid's /m <12-34-56-78-90-ab,…> Log only specified bssid's /l <file name> Enable logging to specified file name /d Append to existing log file instead of deleting it first /e Log all access points /c Use , for log file instead of tab /f <filter> Filter access points for display and logging /t <x> Exit application after x milli seconds /a Log currently connected ap /p Or portable.dat file is in same folder, use portable ... |
 |
4,693 | Nov 15, 2024 The SZ Development 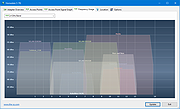 |
|
| HTTPNetworkSniffer v1.63 32bit HTTPNetworkSniffer v1.63 32bit HTTPNetworkSniffer is a packet sniffer tool that captures all HTTP requests/responses sent between the Web browser and the Web server and displays them in a simple table. For every HTTP request, the following information is displayed: Host Name, HTTP method (GET, POST, HEAD), URL Path, User Agent, Response Code, Response String, Content Type, Referer, Content Encoding, Transfer Encoding, Server Name, Content Length, Cookie String, and more... You can easily select one or more HTTP information lines, and then export them to text/html/xml/csv file or copy them to the clipboard and then paste them into Excel. System Requirements This utility works on any version of Windows, starting from Windows 2000 and up to Windows 10, including 64-bit systems. One of the following capture drivers is required to use HTTPNetworkSniffer: WinPcap Capture Driver: WinPcap is an open source capture driver that allows you to capture network packets on any version of Windows. You can download and install the WinPcap driver from this Web page. Microsoft Network Monitor Driver version 2.x (Only for Windows 2000/XP/2003): Microsoft provides a free capture driver under Windows 2000/XP/2003 that can be used by HTTPNetworkSniffer, but this driver is not installed by default, and you have to manually install it, by using one of the following options: Option 1: Install it from the CD-ROM of Windows 2000/XP according to the instructions in Microsoft Web site Option 2 (XP Only) : Download and install the Windows XP Service Pack 2 Support Tools. One of the tools in this package is netcap.exe. When you run ... |
 |
8,751 | Dec 06, 2019 Nirsoft 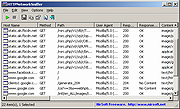 |
|
| HTTPNetworkSniffer v1.63 64bit HTTPNetworkSniffer v1.63 64bit HTTPNetworkSniffer is a packet sniffer tool that captures all HTTP requests/responses sent between the Web browser and the Web server and displays them in a simple table. For every HTTP request, the following information is displayed: Host Name, HTTP method (GET, POST, HEAD), URL Path, User Agent, Response Code, Response String, Content Type, Referer, Content Encoding, Transfer Encoding, Server Name, Content Length, Cookie String, and more... You can easily select one or more HTTP information lines, and then export them to text/html/xml/csv file or copy them to the clipboard and then paste them into Excel. System Requirements This utility works on any version of Windows, starting from Windows 2000 and up to Windows 10, including 64-bit systems. One of the following capture drivers is required to use HTTPNetworkSniffer: WinPcap Capture Driver: WinPcap is an open source capture driver that allows you to capture network packets on any version of Windows. You can download and install the WinPcap driver from this Web page. Microsoft Network Monitor Driver version 2.x (Only for Windows 2000/XP/2003): Microsoft provides a free capture driver under Windows 2000/XP/2003 that can be used by HTTPNetworkSniffer, but this driver is not installed by default, and you have to manually install it, by using one of the following options: Option 1: Install it from the CD-ROM of Windows 2000/XP according to the instructions in Microsoft Web site Option 2 (XP Only) : Download and install the Windows XP Service Pack 2 Support Tools. One of the tools in this package is netcap.exe. When you run ... |
 |
8,921 | Dec 06, 2019 Nirsoft  |
|
| Internet Processes Viewer v3.8.5.0 Internet Processes Viewer v3.8.5.0 Retrieves detailed snapshots of your computer’s active TCP and UDP network connections along with the owning processes and users each time you run it. It gives quick results with a level of detail helpful when analyzing Cybersecurity incidents and troubleshooting network applications. SHA-256: 814fa4d55277e46a81ca07c110977191f521499989acbee2bff7e41d0b2d1c28 This application may be used at no cost after reading and accepting the built-in EULA. Typical write access to your interactive user's HKCU Software registry is required for the product license acceptance. Uniquely identify executable modules used in creating and maintaining suspicious network connections. Provide .csv reports from the application running on an endpoint of interest to your Cybersecurity support team. Intended target audience: Cybersecurity, Network, Systems Analysts, and similar technical users. Click the question mark in the upper right hand corner of the program for full instructions on it's use. Minimum system requirements Microsoft Windows 10 or 11 and .NET 6 Click here to visit the author's website. |
 |
3,416 | Jun 13, 2022 Steve Chaison Software |
|
| Invoke-PingSweep v1.0 Invoke-PingSweep v1.0 This cmdlet is meant to perform a ping sweep of a defined subnet. This will enumerate any hosts on a network that respond to pings. If IP source routing is enabled this function will allow you to define one single source address or use a random source address for every ping to each device. This cmdlet is used to perform a ping sweep of a defined subnet. Executioner is able to define the start and end IP range to use Executioner is also able to define a source to mask where the ping sweep is coming from. Click here to visit the author's website. |
 |
2,703 | Jun 15, 2021 Robert H. Osborne  |
|
| IP Extractor v1.0 IP Extractor v1.0 IP Extractor is a simple Windows OS software application which allows you to easily extract IP addresses from files, folders, urls and text snippets. With this program you can extract IP addresses from entire folders or hard disks by filtering file extensions to search (i.e *.log or *.txt). You can copy the extracted IP addresses to the Windows clipboard, export the IP addresses to a text file, extract IPs from plain text (txt) files, and much more. It supports scanning also of big files (i.e 500+ MB). For Windows XP, Vista, 7, 8, 10 (32\64-bit) Extract IPs from Files, Folders, URLs This tool can help you extract IP addresses from text files (i.e .txt, .log, etc), from folders, from a web page URL and from text snippets. If you need to extract IP addresses from thousands of log files (generated by, for example, Apache or Nginx), you can use this tool to scan a specific folder recursively looking for .log files and extract all the unique IP addresses found. The program is able to extract IP addresses from many file formats, such as HTML, TXT, CSV, JSON, XML, LOG, PDF, etc. Extract IP Addresses Extract IPs from files, folders, web page URL and text snippets. Scan Folders Scan a folder (and sub-folders), filtering file extensions, to extract IPs from files. Exclude IPs You can use wildcard rules to exclude a particular IP from being extracted. Export IPs List With a mouse click you can copy the IPs to the clipboard or export them to a file. Simple Interface The program interface is well organized and simple to use also for beginner users. No Spyware/Adware The program is free from spyware, adware or other pests, nothing extra is installed. Click here to visit the author's website. |
 |
4,600 | Mar 15, 2019 NoVirusThanks 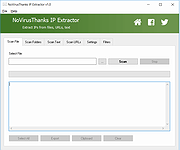 |
|
| IPaddress v3.0.1 IPaddress v3.0.1 Instantly Find Your IP Address IPaddress is a tiny utility that you can use to determine your IP address and lets you copy it to the computer's Clipboard. You can then paste it from there into whatever application or document that requires it. You can also send your IP address with the build-in e-mail engine to fellow gamers or to friends or to colleagues at the office so that they can find your computer for remote access. Both WAN and LAN are supported. Options/Features Finds both your WAN and LAN IP addresses Allows you to save them or copy them to the clipboard Information window with search functionality to find the source of a particular IP Send the IP address to your friends with build-in e-mail (supports Exchange Server) Keeps a history log of your IP addresses Runs on Windows 2k/2k3/2k8/XP/V/7/8/10 Download an older version compatible with Windows 95, 98 and NT4 From version 2.0.6 up, IPaddress will not run on these older systems anymore. However, you can still access and use version 2.0.5 without the WAN support and the Information window. Get this version HERE. Click here to visit the author's website. |
 |
3,438 | Jun 28, 2020 David De Groot 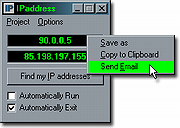 |
|
| IPerf2 v2.2.0 IPerf2 v2.2.0 A tool that measures network performance of TCP/UDP including latency for Windows, macOS and Linux A network traffic tool for measuring TCP and UDP performance with metrics around both throughput and latency. The goals include maintaining an active iperf code base across a broad set of platforms and operating systems. This is a multi-threaded design which scales with the number of CPUs or cores within a system. Changes v2.2.1 (as of June 11th, 2024) • don't autoset --tcp-write-prefetch with --trip-times, warn instead • Add Android NDK example, add mingw64 example • set smallest prefetch to 256K • print wait time on server side with --tx-starttime • fix header code #if mismatch of (HAVE_DECL_SO_TIMESTAMP) && (HAVE_DECL_MSG_CTRUNC) per ticket 328 • fix client side bb summing • fix format error in timestamps • 1) Support CSV for isochronous, both UDP and TCP 2) Reorganise CSV report assignement to be more logical. • support milliseconds and microseconds with iperf_formattime, also make sure the leading zeros are printed per the field width • fix multiple pps regressions • csv patches per ticket 320 and 322 • add per direction byte counts with bounceback on client (server side code yet to be done) • fix summing init code per ticket 324 • tcp working load should use full capacity seeking behaviors • fix csv compile breakage on MAC • use append for --ouput vs w, ticket 321 • use --ipg units of seconds • fix settings calculations when -b is given for --burst options • improve port range / traffic thread count (-P) warning • add transferid to recvmsg warning • compute packet pps accounts for interval crossing using that timestamp vs packet timestamp • use object setnow() method to set lastPackeTime in first packet delay • pps calculation needs to include partial gap value with IPGsum ahead of PPS output • minor fixes for DEBUG_PPS support • fix initial udp write delay and reporting • Rerun autoconf • Remove ... |
 |
2,243 | Aug 05, 2024 Robert McMahon 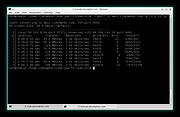 |
|
| IPNeighborsView v1.01 IPNeighborsView v1.01 A tool for Windows 10/8/7/Vista that displays the IP neighbor table of your local computer. For every IP neighbor entry, the following information is displayed: IP Address, MAC Address, MAC Address Company, State, State Time, Local Adapter Name, Local Connection Name. In the IP neighbor table, you can find the details of computers and devices recently connected to your network. computers and devices are listed only if Windows operating system detected them. System Requirements This tool works on any version of Windows, starting from Windows Vista and up to Windows 10. Both 32-bit and 64-bit systems are supported. Changes v1.01 Fixed to sort properly the IP Address column. Start Using IPNeighborsView IPNeighborsView doesn't require any installation process or additional DLL files. In order to start using it, simply run the executable file - IPNeighborsView.exe Afer running IPNeighborsView, the main window displays the current IP neighbor table of your system. By default, IPNeighborsView hides the permanent items in the IP neighbor table, but you can view these items by unchecking the 'Hide Permanent Items' options (Under the Options menu). You can select one or more items (or press Ctrl+A to select all of them) and then use the 'Save Selected Items' option (Ctrl+S) to export the table to comma-delimited/tab-delimited/HTML/XML/JSON file. Command-Line Options /stext <Filename> Save the IP Neighbors items to a simple text file. /stab <Filename> Save the IP Neighbors items to a tab-delimited text file. /scomma <Filename> Save the IP Neighbors items to a comma-delimited text file (csv). /shtml <Filename> Save the IP Neighbors items to HTML5 file (Horizontal). /sverhtml <Filename> Save the IP Neighbors items to HTML5 file (Vertical). /sxml <Filename> Save the IP Neighbors items to XML file. /sjson <Filename> Save the IP Neighbors items to JSON file. Translating IPNeighborsView to other languages In order to translate IPNeighborsView to other language, follow the instructions below: Run ... |
 |
2,550 | Mar 18, 2022 Nir Sofer  |
|
| IPPathTableView v1.00 IPPathTableView v1.00 A tool for Windows 11/10/8/7/Vista that displays the IP path table of your local computer. For every IP path entry, the following information is displayed: Source, Destination, Next Hop, MTU, Reachaable (Yes/No), Adapter Name, Connection Name, Link Transmit Speed, Link Receive Speed. The IP path table contains the list of all IP Addresses that your computer connected recently System Requirements This tool works on any version of Windows, starting from Windows Vista and up to Windows 11. Both 32-bit and 64-bit systems are supported. Start Using IPPathTableView IPPathTableView doesn't require any installation process or additional DLL files. In order to start using it, simply run the executable file - IPPathTableView.exe Afer running IPPathTableView, the main window displays the current IP path table of your system. You can press F5 to refresh the display of IP path table, or you can automatically refresh the display every 1 - 10 seconds by using the Auto Refresh option (Under the Options menu). You can select one or more items (or press Ctrl+A to select all of them) and then use the 'Save Selected Items' option (Ctrl+S) to export the table to comma-delimited/tab-delimited/HTML/XML/JSON file. Command-Line Options /stext <Filename> Save the IP path table to a simple text file. /stab <Filename> Save the IP path table to a tab-delimited text file. /scomma <Filename> Save the IP path table to a comma-delimited text file (csv). /shtml <Filename> Save the IP path table to HTML5 file (Horizontal). /sverhtml <Filename> Save the IP path table to HTML5 file (Vertical). /sxml <Filename> Save the IP path table to XML file. /sjson <Filename> Save the IP path table to JSON file. Translating IPPathTableView to other languages In order to translate IPPathTableView to other language, follow the instructions below: 1) Run IPPathTableView with /savelangfile parameter: IPPathTableView.exe /savelangfile A file named IPPathTableView_lng.ini will be created ... |
 |
1,949 | Feb 06, 2024 Nir Sofer  |
|
| LiveTcpUdpWatch v1.41 LiveTcpUdpWatch v1.41 A free tool for Windows that displays live information about all TCP and UDP activity on your system. Every line in the main table of LiveTcpUdpWatch displays the protocol (TCP/UDP/IPv4/IPv6), local/remote IP address, local/remote port, number of sent/received bytes, number of sent/received packets, connect/disconnect time (For TCP only), and the process (ID and path) responsible for this activity. LiveTcpUdpWatch vs CurrPorts vs NetworkTrafficView This tool may look very similar to other tools of NirSoft - CurrPorts and NetworkTrafficView, but every tool behave differently and uses different technique to extract the network information. CurrPorts displays the current table of active TCP connections and TCP/UDP listening ports. but this technique has some disadvantages, for example, if UDP packets are sent from your computer to remote network address, you won't see it with CurrPorts, because with UDP there is no really a connection and the UDP table contains only listening UDP ports. The advantage of CurrPorts is the ability to use it without elevation (Run As Administrator). NetworkTrafficView uses network sniffing technique - It analyzes every packet sent/received by your network card and displays extensive summary according to the display mode you choose. The disadvantages of this tool: You have to choose a network card and capture method for activating the network sniffer. LiveTcpUdpWatch uses event tracing API to get live information from Windows Kernel about every TCP/UDP packet sent/received on your system. As opposed to CurrPorts, it captures all UDP activity with process information, but without the need of using a network sniffer. System Requirements This tool works on any version of Windows, starting from Windows XP and up to Windows 11. Both 32-bit and 64-bit versions of Windows are supported. On Windows Vista and later this tool requires to run as Administrator ... |
 |
5,456 | Feb 23, 2022 Nir Sofer  |
|
| MACAddressView v1.50 MACAddressView v1.50 A MAC address lookup tool that allows you to easily find the company details (company name, address, and country) according to the MAC address of a product. MACAddressView also allows you to find MAC address records according to the company name, company address, or country name. After finding the desired MAC address records, you can save them into text/xml/HTML/csv file or copy them to the clipboard and paste them into Excel or other applications. MACAddressView doesn't send any request to a remote server, it simply uses the internal MAC addresses database stored inside the .exe file. System Requirements This utility can be used in any version of Windows, from Windows 98 and up to Windows 11. Changes v1.50: Added 'Save All Items' option (Shift+Ctrl+S). Updated the internal MAC Addresses database. Using MACAddressView MACAddressView doesn't require any installation process or additional DLL files. In order to start using it, simply copy the executable file (MACAddressView.exe) to any folder you like, and run it. After running MACAddressView, the 'Find MAC Address Records' will appear. By default, the 'Find By' option is set to 'MAC Address'. In this mode, you can type one or more MAC Addresses, separated by space, comma, or Enter key. You can try a full MAC address (like 01-02-03-04-05-06) or only the first 3 bytes of the address (like 01-02-03). After typing all MAC Addresses you need, click the 'Ok' button to view the details of all MAC records that you asked. You can also locate a MAC record according to the company name, company address, or country name. You can look in the examples below to find out what you can do with these options. Examples of what you can find with MACAddressView All MAC addresses range used by companies in Germany and Austria: ... |
 |
9,320 | Dec 31, 2024 Nir Sofer  |
|
| MacMakeup v2.2.3.5 MacMakeup v2.2.3.5 MacMakeup allows you to change the MAC address of any of the network interfaces present on your Windows system. This is sometimes referred as "MAC address spoofing". You can choose a new address of your choice, or get the new one with the help of the tool, which sets the OID part according to your preference. Usage This is a simplified version compared to the original one, but the basic task are accomplished in the same way. The interface is pretty simple: To spoof your MAC address you just need to: 1. Select your network interface 2. Type the new MAC address into the box 3. Click "Spoof" Done! You just need to disable and enable the interface again. If the MAC is already spoofed on an interface you can use the "Reset to original" button to go back to your original one. Command line (scripted) usage Since versions 2.2.x you can use MacMakeup from the command line. You can automate tasks like having a new MAC at each boot, or switch from one MAC to the other in a click or following events. For example the Windows scheduler allows you to execute script based on a lot of events. When using scripting the GUI interface does not show up if not for critical errors, any output will be directed to a macmakeup.txt file created in the same directory the executable resides. So you must have permission to write to that directory (do not put it in Windows32!). You just start MacMakeup with some command line arguments. Valid ones are: list: writes the list of available interfaces to the macmakeup.txt file. The list contains the interface GUID and the description. It is something like: {6A4464B2-0FF4-4D69-B0E3-6D7DC289C41B} Bluetooth Network Connection {B42E9999-20A5-4F43-B12B-B7670A0D4214} Local Area Connection {0FF40FF4-20A5-4D69-B12B-B0E3B0E3B0E3} WiFi adapter ... |
 |
4,931 | Dec 20, 2019 Marcello Gorlani 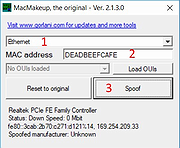 |
|
| ManageWirelessNetworks v1.16 ManageWirelessNetworks v1.16 An alternative tool to the standard 'Manage Wireless Networks' of Windows (or 'Manage Known Networks' on Windows 10). It displays extensive information about every wireless profile on your system, even if the network adapter is not active. For every wireless profile, the following information is displayed: Profile Name, SSID, Connection Type, Connection Mode, Authentication, Encryption, Key Type, Auto Switch (Yes/No), Non Broadcast (Yes/No), Profile Position, Created Time, Modified Time, Wireless Key, and more... ManageWirelessNetworks also allows you to edit a single profile with the standard editor of Windows, edit the XML of the wireless profile (For advanced users only !), quickly switch between manual and automatic mode, quickly switch between WPAPSK/WPA2PSK/AES/TKIP modes, rename the profile, rename the SSID, move profile position up and down, copy multiple wireless profiles to another wireless card on your system, and more... System Requirements This tool works on any version of Windows, starting from Windows Vista and up to Windows 11. Both 32-bit and 64-bit systems are supported. This tool is just a small standalone .exe file that you can run on any system without installing anything. Changes: v 1.16 Added 'Save All Items' option. Start Using ManageWirelessNetworks ManageWirelessNetworks doesn't require any installation process or additional DLL files. In order to start using it, simply run the executable file - ManageWirelessNetworks.exe After you run the ManageWirelessNetworks tool, the main window displays the details of all wireless profiles on your system. You can select one or more profiles from the list and then choose the desired action from the top menu or from the right-click context menu. Be aware: ManageWirelessNetworks displays all wireless profiles on your system, even if the wireless adapter is not active. However, most actions (like edit profile, rename SSID, and so on...) only works for wireless profiles with ... |
 |
2,370 | Jun 24, 2025 Nir Sofer  |
|
| My IP v1.00 My IP v1.00 My IP reads the public IP of your internet connection and reports it in the systray area. My IP can also send an alert email when the IP changes. What's new in 1.00: - first release |
 |
5,951 | Apr 09, 2016 My Portable Software  |
|
| MyArp v1.2 MyArp v1.2 A free open source alternative command line program to Microsoft's Arp program. Some background: ARP stands for Address Resolution Protocol, to learn more you can read all about it here Microsoft's Arp program is documented here What MyArp does: MyArp, like ARP, is a command line program. It does not do all the things APR does, but for what it does - it does more. MyArp is focused on reporting devices that are either connected or have been connected to your network. Unlike Microsoft's ARP program, it is does not add to or delete from the ARP cache. Below are two screenshots, the one on the taken from Microsoft's ARP, and the other from MyARP: Microsoft's ARP MyArp MyArp provides the following features over ARP: reports device names allows you to add and edit user friendly device descriptions that are also reported keeps a history of devices that have been seen in the past, and if they are not actively connected to your network reports when they were last seen provides more accurate reporting by pinging devices on your network before reporting them (as this can be time consuming there is also an option to not ping) Here is how you can use MyArp from the command line: MyArp /? /ADD [Physical Address] (Description) /DEL [Physical Address] /C /DBB /DBD /DBE /DBR /NP /NRA /NRI /NRD /NRS /P /Q /R /? = show (this) help and exit /ADD [Physical address] (Description) = Add or update a database entry and description only one /ADD statement is allowed at a time an /ADD statement must be the only statement on a line example /ADD statements look like this: /ADD 7C:DD:90:00:00:01 /ADD 7C:DD:90:00:00:02 Raspberry Pi Wireless /DEL [Physical address] = Delete a database entry only one /DEL statement is ... |
 |
2,119 | Mar 31, 2022 Rob Latour 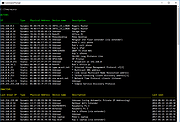 |
|
| MyNet Toolset 1.0.0.116 MyNet Toolset 1.0.0.116 Detects all nodes in your local network and displays them on the graphical network map. AdRem MyNet Toolset scans any node and checks for popular network services running on it. Enables personalization of popup menu for each node in order to get easy access to common network tools. Access all your network tools from the network map. Right-click the network node icon and speed up diagnostic and troubleshooting tasks. |
 |
6,624 | Sep 02, 2015 AdRem Software, Inc. 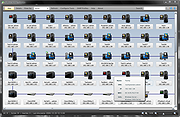 |
|
| MyRouter Log v1.1 MyRouter Log v1.1 MyRouter Log is essentially a UDP listener, designed to listen to log file broadcasts like those produced by most home style ADSL Modem / Routers. Routers keep a log file of activity but when the router crashes in most instances the log is lost. You need a program like "MyRouterLog" to capture the log file so you can review the log files after a crash. MyRouter Log has the following features: Configurable to listen on any port Logs the results to a text file in logs directory. Captures log results and displays in the UI. Minimises to the system tray and shows last message User Guide included in help menu Main application window with live logging of router broadcasts. Preferences Screen Minimised to system tray, showing last router message Shortcut to Log file directory. Version 1.1 Released 1/06/2018 Updated due to installer issues, no functional change Requires updated .net 4.6.1 or later Click here to visit the author's website. |
 |
5,407 | Jan 05, 2020 homedev 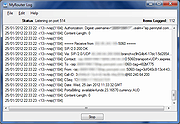 |
|
| NetCrunch Admin Toolset v2.0.0.63 NetCrunch Admin Toolset v2.0.0.63 Set of tools for administrators containing various tools in visual form. Besides traditional tools such as Ping, it includes network scanners and "DNS Audit," which can help in identifying problems with DNS configuration. Tcp/Ip Tools Ping Traceroute Wake on LAN DNS Info Who Is Subnet Tools DNS Audit MAC Address Resolver Subnet Calculator Net Scanners Ping Sweep Network Services Scanner Open Port Scanner SNMP Scanner Click here to visit the author's website. |
 |
6,638 | Jan 23, 2021 AdRem Software, Inc. 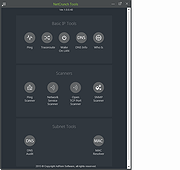 |
|
| NetGraph v1.8.0.69 NetGraph v1.8.0.69 NetGraph is a free to use network traffic monitor. It shows real-time information about the state of network traffic in a visual display format selected by the user. NetGraph can monitor the data flows of wired, Wi-Fi and mobile broadband connections, as well as that of the local network and the internet. The programs unique functions include several types of display modes and the active tray icon. By selecting and setting these appropriately, the user can always access the most network information without interfering with the display of other programs. In case of graphical representations, the sampling frequency can be chosen, and the limit value of the displayed graph or progress indicator can be set too. A unique function is the option to set an input averaging level, which significantly enhances the program’s user experience and enables efficient displays. Properties of NetGraph: Several display modes: graph, progress indicator and numeric values, as well as the combination of these in several sizes When using more than one network card, the data source can be selected The active tray icon shows information about the most important data in a simple way, even if the program window is hidden Supports wired, Wi-Fi and mobile broadband connections The display format and the transparency can be selected Click-through: it makes the area covered by the NetGraph window visible and clickable by mouse in a fast and simple way Shows basic information about the network and offers an easy method to ping multiple IP addresses Doesn’t require installation, free to use, it supports Windows 7/8/10 operating systems MD5: fc0fd2be50d916287ee50bee63504d8a Version: 1.8.0.69 - Date: 2019-03-26 Digitally signed Click here to visit the author's website. |
 |
5,385 | Oct 17, 2020 WinTools  |
|
| Nethor v2023.1.0 Nethor v2023.1.0 Packet Analyzer and Visualizer Nethor is a free packet analyzer and visualization tool for Windows that can capture and decode data packets, and also allows working with multiple open PCAP/PCAPNG files, operated as one, from a modern UI. It visualizes packets on a timeline, displays nodes on a world map and it lets you arrange connections in a matrix. Nethor has many features and details to aid packet/network forensic and analysis. Features: Offline analysis of tcpdump (libpcap) and Pcap NG files Multiple files can be opened and operated as one Runs on Windows Packet filtering Detailed inspection of several protocols Supported linktypes are Ethernet, IEEE 802.11 and IPv4/6 Live capture supporting WinPcap/Npcap drivers Visualized connections in matrix Visualized IP connections in a World map Visualized packets on a timeline with drag & drop zoom Passive OS fingerprinting using databases from Satori Packet Playback Resolves physical, network and transport addresses (uses captured DNS data for address resolution) Resolves IP addresses using system DNS servers. Disabled by default Extracts host/domain names from DHCP packets. Extracts NetBIOS names from NBNS/NBDS packets Geo IPv4 and IPv6 integrated Simple packet data hex/text edit Packet data hex/text search Diagnostic tools with Geo locations: Traceroute, Ping, DNS Lookup Many customizable settings to setup application as you prefer. Automatically stored MAC address Information: Age, organization and address I/O graph Top 5-20 chart with several categories All modules/views ... |
 |
4,746 | Sep 20, 2023 Are Chr. Taraldsen 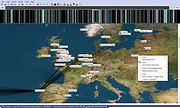 |
|
| NetMeter v1.1.41 NetMeter v1.1.41 A modification of the classic Netmeter Evo (Oliver Winterholler) that will run on Windows 7,8 & 10 A free, small network bandwidth monitoring program with many parameters for customization. View daily, weekly or monthly usage reports and projected usage based on current data. Click here to visit the author's website. |
 |
6,389 | Apr 24, 2020 oopepe 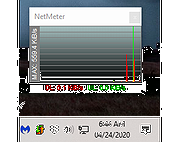 |
|
| NetRouteView v1.35 NetRouteView v1.35 NetRouteView is a GUI alternative to the standard route utility (Route.exe) of Windows operating system. It displays the list of all routes on your current network, including the destination, mask, gateway, interface IP address, metric value, type, protocol, age (in seconds), interface name, and the MAC address. NetRouteView also allows you to easily add new routes, as well as to remove or modify existing static routes. Notice: Currently, this utility doesn't support IPv6. System Requirements This utility works on any version of Windows, starting from Windows 2000, and up to Windows 10. Version 1.35: When you add a new route, the new dialog-box is filled with the values you used in the previous time. When you add a new route, NetRouteView now automatically fills the lowest metric value on your system. Using NetRouteView NetRouteView doesn't require any installation process or additional dll files. In order to start using it, simply copy the executable file (NetRouteView.exe) to any folder you like, and run it. The main window of NetRouteView displays the list of all your network routes, like the 'print' command in the route utility of Windows. You can select a single route and then delete it (Del key) or modify it (Ctrl+M). Be aware that only routes with 'Static Route' value in the Protocol column, can be deleted or modified. You can also add a new route by using 'New Route' option (Ctrl+N). Notice: If you are using NetRouteView on Windows 7/Vista/2008 with UAC turned on, you must right-click on NetRouteView.exe and choose 'Run As Administrator' in order to be able to add, remove, or delete network routes. Using The 'Switch Metric Values' Option If you have more than one network adapters with Internet connection, the 'Metric' value is used to determine which Internet connection will ... |
 |
3,358 | Oct 20, 2020 Nir Sofer  |
|
| NetStumbler v0.4.0 NetStumbler v0.4.0 NetStumbler is a tool for Windows that allows you to detect Wireless Local Area Networks (WLANs) using 802.11b, 802.11a and 802.11g. It has many uses: Verify that your network is set up the way you intended. Find locations with poor coverage in your WLAN. Detect other networks that might be causing interference with your network. Detect unauthorized "rogue" access points in your workplace. Help aim directional antennas for long-haul WLAN links. Use it recreationally for WarDriving. Requirements General Requirements The requirements for NetStumbler are somewhat complex and depend on hardware, firmware versions, driver versions and operating system. The best way to see if it works on your system is to try it. Some configurations have been extensively tested and are known to work. These are detailed at http://www.stumbler.net/compat. If your configuration works but is not listed, or is listed but does not work, please follow the instructions on the web site. The following are rules of thumb that you can follow in case you cannot reach the web site for some reason. This version of NetStumbler requires Windows 2000, Windows XP, or better. The Proxim models 8410-WD and 8420-WD are known to work. The 8410-WD has also been sold as the Dell TrueMobile 1150, Compaq WL110, Avaya Wireless 802.11b PC Card, and others. Most cards based on the Intersil Prism/Prism2 chip set also work. Most 802.11b, 802.11a and 802.11g wireless LAN adapters should work on Windows XP. Some may work on Windows 2000 too. Many of them report inaccurate Signal strength, and if using the "NDIS 5.1" card access method then Noise level will not be reported. This includes cards based on Atheros, Atmel, Broadcom, Cisco and Centrino chip sets. I cannot help you figure out what chip set is in any given card. Firmware Requirements If you have an old WaveLAN/IEEE card then please note that ... |
 |
5,578 | May 05, 2019 Marius Milner 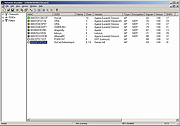 |
|
| NetTraffic v1.66.0 NetTraffic v1.66.0 Tool for monitoring network traffic (bandwidth) on selected interfaces. Key features, tags Network traffic, network monitoring, network data rate (sent / received), network bandwidth, network throughput, network speed meter, network activity, network usage history, network usage predictions. Data flow rate (download / upload) - instant view. Traffic monitoring, traffic counter, traffic usage, traffic monitor. Bandwidth speed, bandwidth monitor, bandwidth usage, bandwidth meter, bandwidth monitoring. Link throughput, network interface throughput, connection throughput. Internet connection speed monitoring, Internet link data rate. Quota counter, data transfer limit usage meter, data plan usage. Feature usable for users with limited Internet connection. In some cases (e.g. mobile Internet) data amount is limited or / and speed over exceeding data limit is limited. Quota counter show usage of data limit and lapse of (billing) period. Usage statistics, data transfer usage tracking, data meter, data sent, data received, data usage charts. Realtime, real time statistics, real time data rate chart, live link speed plot, live throughput graph. Network tray icon (network activity indicator), customizable networking tray icon, classic network tray icon, notify icon. Network interfaces, adapters, cards, links, connections monitor. Tool, software, application, utility. Modes: installer, portable (instant, standalone). Multi-language. Lightweight. Freeware, free. Supported Operating Systems Windows: all (32-bit and 64-bit). Requirement: .NET Framework 2.0 or above Hash (md5): 1c5f75845df159de5ad75d12f534e0c5 Change Info: 1.66.0 Uniform state persistence for different systems versions. HTTP(S) parser - extended requests timeouts when used authentication: none / Basic / Digest. Click here to visit the author's website. |
 |
9,189 | Apr 23, 2020 Venea 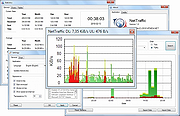 |
|
| Network / IP Scanner Shared Resources 1.1.0 Network / IP Scanner Shared Resources 1.1.0 Network/IP Scanner Shared Resources is an application that helps you find open SMB shared resources on the Internet. It checks the computers only with open NBT ports, that allows you quickly scan large IP-ranges. License: Freeware. Installation and use: 1) You must have administrator privileges 2) Install WinPcap driver "WinPcap\WinPcap.exe" 3) Run "Bin\NetIpScan.exe" Attention: This program is designed to find shared resources on the Internet. The Program does not work with PPP/PPPoE/PPTP/L2TP connection directly (Modem, ADSL, WiFi, VPN) . You need to install the router and configure it for PPP/PPPoE/PPTP/L2TP connection, then connect computer to router by network cable. If program does not work or work very slow, then you must disable all firewalls, antiviruses and ndis filters. |
 |
5,939 | May 04, 2016 S.K. Software 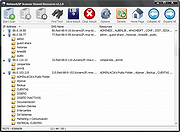 |
|
| Network Profile Name Changer v1.4 Network Profile Name Changer v1.4 Delete / Rename Network Connections When you connect to a Ethernet or wired network for the first time, Windows automatically creates a network profile and assigns generic names like Network 1, Network 2, etc. finally stores it on your computer as a known network. A wireless network profile will use the SSID of the wireless network (ex: router) . Some users and administrators may dislike the non-descriptive network connections names and want to rename , delete or clear redundant network profiles (names). After Windows 7 , Microsoft removed Netork Profile rename option therefore you will not find any option whatsoever in the Settings app or Control Panel to change the network name. It is still possible to edit network profile names to make them more descriptive but the only effective way to Rename or remove the connections in Windows 11, Windows 10 and Windows 8 is by using the registry editor. (valid in all Windows versions) Changes What is New (Thursday, September 28, 2023) 1.[FIXED] – Deleted network profile leaves leftover in a registry key 2.[FIXED] – Can’t upper/lower letter in renaming 3.[ADDED] – Multiple selection feature in the List with Ctrl key 4.[ADDED] – x64 version 5.[ADDED] – High contrast support 6.[ADDED] – Manage Known Networks has been added (Under the menu button) 7.[ADDED] – Some code Improvements How to Change the Active Network Profile Name You can check the current name in the Network and Sharing Center on Windows , press the Windows + R keys to open the Run dialog, type one of the following commands and press Enter. control.exe /name Microsoft.NetworkAndSharingCenter explorer.exe shell:::{8E908FC9-BECC-40f6-915B-F4CA0E70D03D} The name of the network is displayed at the very top of the page. Windows Users have three main options to change a network name; 1. Using Local Security Policy (It is only available in professional versions of Windows) 2. Using the Windows Registry 3. Using Network ... |
 |
3,723 | Mar 17, 2024 Sordum.org 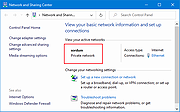 |
|
| Network Spy Monitoring Software 1.0 Network Spy Monitoring Software 1.0 IMPORTANT: The zip file will ask you to enter a password. Just leave it blank. Network Spy Monitoring Software main use is to Monitor Network activities on authorized LAN Networks in real-time with a very fast ping scan. rogram Features: 1. Fast Ping Scan! 2. No PayPal Donations SPAM! 3. Easy To Use 4. 100% FREEWARE 5. 100% Spyware Free 6. Compatible With Windows 8 7. Very Lightweight 8. User Elevation 9. Newer Interface 10. Background Scan 11. Open Computer via Explorer etc. 12. VNC Remote Desktop Monitoring 13. User Interface Update - New Feature! |
 |
6,957 | Oct 11, 2016 Blackbox HACKER 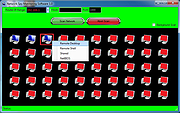 |
|
| NetworkConnectLog v1.16 NetworkConnectLog v1.16 Repeatedly scans your local area network and logs computers /devices as they connect or disconnects from network. NetworkConnectLog is a simple utility that repeatedly scans your local area network (Using ARP and Netbios protocols) and add a new log line every time that a new computer or device connects to your network, and when a computer or device disconnects from your network. After the connect/disconnect log lines are accumulated, you can easily export the log lines to comma-delimited/tab-delimited/html/xml file. System Requirements This utility works on any version of Windows, starting from Windows 2000 and up to Windows 11. Both 32-bit and 64-bit systems are supported. Known Issues In some circumstances, Smartphone devices don't respond to ARP requests, even when the device shows that it's actually connected to the network. In this situation, NetworkConnectLog will show that the device is disconnected. Changes: v1.16: Fixed to display a check mark when the 'Put Icon On Tray' option is turned on. Start Using NetworkConnectLog NetworkConnectLog doesn't require any installation process or additional dll files. In order to start using it, simply run the executable file - NetworkConnectLog.exe After you run NetworkConnectLog.exe, it immediately starts to scan your network. The first scan is fast, in order to detect all computers and devices that are currently connected to your network. After the first scan, NetworkConnectLog repeatedly scans your network in lower speeds in order to check if computer/devices connected or disconnected to your network. Every time that NetworkConnectLog detects that computer or device connected or disconnected to your network, a new log line is added. If from some reason NetworkConnectLog fails to detect your network properly, you should go to the 'Scan Options' window (F9) and choose the correct network adapter or IP addresses range ... |
 |
6,346 | Feb 20, 2024 Nir Sofer  |
|
| NetworkCountersWatch v1.02 NetworkCountersWatch v1.02 NetworkCountersWatch is a tool for Windows that displays system counters for every network interface on your system. The system counters include the number of incoming/outgoing bytes, number of incoming/outgoing packets, number of broadcast packets, and more. You can also initialize all counters to zero at any time in order to watch the network counters for specific event. NetworkCountersWatch also calculates and displays the current download speed and upload speed on your network interface. System Requirements This utility works on any version of Windows, starting from Windows Vista and up to Windows 10. (Windows XP is not supported). Both 32-bit and 64-bit systems are supported. Changes: Version 1.02: Added 'Select All' and 'Deselect All' to the 'Column Settings' window. Start Using NetworkCountersWatch NetworkCountersWatch doesn't require any installation process or additional DLL files. In order to start using it, simply run the executable file - NetworkCountersWatch.exe After running NetworkCountersWatch, the main window displays a table with the counters of active network interfaces. By default, Both 'Show Only Items With Non-Zero Counters' and 'Show Only Hardware Interfaces' options are turned on. In order to see all network interfaces on your system, you should turn off these options, but when you do it, you might see multiple interfaces with exactly the same counters. Reset And Restore Counters You can use the 'Reset Counters Of Selected Items' option (F7) in order to initialize all counters to zero. Be aware that NetworkCountersWatch doesn't actually reset the system counters, it simply takes a snapshot of the current counters and then shows you the difference between the snapshot and the system counters. You can restore back the display of actual system counters by using the 'Restore Counters Of Selected Items' option. Counters Description Here's the description of all network counters displayed by NetworkCountersWatch, taken from official documents of Microsoft: ... |
 |
5,444 | Jan 28, 2020 Nir Sofer  |
|
| NetworkInterfacesView v1.35 NetworkInterfacesView v1.35 Show info on all network adapters and allows disabling and enabling them. NetworkInterfacesView is a simple tool that displays the list of all network adapters/interfaces installed on your system. It displays network interfaces that are currently active, as well as network interfaces that have been installed previously, and now they are not connected (like USB wireless network adapters). For every network interface found on your system, the following information is displayed (if it's stored in the Registry): Device Name, Connection Name, IP Address, Subnet Mask, Default Gateway, DHCP Server, Status, MAC Address and more... You can select one or more network interface items and then export them to xml/html/csv/tab-delimited file, or copy them into the clipboard and then paste them into Excel or other spreadsheet application. System Requirements This utility works on any version of Windows, starting from Windows 2000 and up to Windows 11. Both 32-bit and 64-bit systems are supported. Changes: v1.35 Added IPv6 addresses and IPv6 DNS servers. Start Using NetworkInterfacesView NetworkInterfacesView doesn't require any installation process or additional DLL files. In order to start using it, simply run the executable file - NetworkInterfacesView.exe After you run NetworkInterfacesView, the main window displays the list of all network interfaces found in the Registry of your system. You can select one or more items, and then export them to xml/csv/tab-delimited/html file by using the 'Save Selected Items' option (Ctrl+S). You can also copy the selected items into the clipboard (Ctrl+C), and then paste them into Excel or other spreadsheet application. Command-Line Options /disable <Name1> <Name2> <Name3>... Disables the specified network adapters. You can specify the Interface GUID, the connection name , and the device name. For example: NetworkInterfacesView.exe /disable "Local Area Connection" NetworkInterfacesView.exe /disable {1BC6B2D1-1606-3029-256F-2EB709923499} {F430061F-D117-29C0-B1A9-F11D473AD7CE} /enable <Name1> <Name2> <Name3>... Enables the specified network adapters. You can specify the Interface GUID, the connection name , and the device name. /DisableEnable <Name1> ... |
 |
4,630 | Mar 26, 2024 Nir Sofer  |
|
| NetworkLatencyView v1.72 NetworkLatencyView v1.72 A simple tool for Windows that listens to the TCP connections on your system and calculates the network latency (in milliseconds) for every new TCP connection detected on your system. For every IP address, NetworkLatencyView displays up to 10 network latency values, and their average. The latency value calculated by NetworkLatencyView is very similar to the result you get from pinging to the same IP address. NetworkLatencyView also allows you to easily export the latency information to text/csv/tab-delimited/html/xml file, or copy the information to the clipboard and then paste it to Excel or other application. System Requirements This utility works on any version of Windows, starting from Windows 2000, and up to Windows 11. Both 32-bit and 64-bit systems are supported. In order to capture the TCP packets properly, you have to install one of the following capture drivers: WinPcap capture driver Network Monitor driver - version 3.4 or later. You can also try to use the 'Raw Socket' method without installing any capture driver. However, this method doesn't work in some systems, as well as the latency values detected by using this method are not very accurate. When using Network Monitor driver on 64-bit system, you must use the 64-bit version of NetworkLatencyView. Changes: Version 1.75: Added support for using the IP-Location files from https://github.com/sapics/ip-location-db for viewing country/city information of remote IP addresses. In order to use these IP-Location files, simply download the desired file and put it in the same folder of NetworkLatencyView.exe with its original filename (For example: asn-country-ipv4.csv , dbip-city-ipv4.csv) Start Using NetworkLatencyView Except of a capture driver that you may need to install, NetworkLatencyView doesn't require any installation process or additional dll files. In order to start using ... |
 |
6,890 | Feb 11, 2024 Nir Sofer  |
|
| NETworkManager v2025.1.18.0 NETworkManager v2025.1.18.0 A powerful tool for managing networks and troubleshoot network problems. Connect to remote systems and manage your network and server infrastructure using tools like Remote Desktop (RDP), PuTTY (SSH, Telnet, Serial), PowerShell (WinRM), TigerVNC (VNC), or AWS Console (AWS SSM). Analyze, troubleshoot, and obtain detailed information about your network and systems with features such as the WiFi Analyzer, IP Scanner, Port Scanner, Ping Monitor, Traceroute, DNS Lookup, and LLDP/CDP Capture (and many more) — all within a unified interface. Hosts and networks can be saved in encrypted profiles and used across all features. Network Analysis Analyze your network and gather detailed information using built-in tools such as the WiFi Analyzer, IP Scanner, Port Scanner, Traceroute, DNS Lookup, Ping Monitor, LLDP Capture, and many more. Remote System Management Connect to remote systems and manage your network and server infrastructure with integrated clients such as Remote Desktop (RDP), PuTTY (SSH, Telnet, Serial), PowerShell (WinRM, WSL, Custom Tools), TigerVNC (VNC), and AWS SSM. Profile Management Save hosts and networks with custom configurations in encrypted profile files to protect sensitive data, organize them by customers or environments, and use them seamlessly across features. Effortless Troubleshooting Diagnose and resolve issues effectively with a comprehensive suite of tools within a unified application. Open Source NETworkManager is fully open source on GitHub. Review the code, build it yourself, or contribute to make it even better. Features: • Dashboard • Network Interface - Information, Bandwidth, Configure • WiFi - Networks, Channels • IP Scanner • Port Scanner • Ping Monitor • Traceroute • DNS Lookup • Remote Desktop • PowerShell • PuTTY (requires PuTTY) • AWS Session Manager (requires AWS CLI ... |
 |
3,098 | Apr 14, 2025 BornToBeRoot  |
|
| NetworkMiner Free v2.6 NetworkMiner Free v2.6 NetworkMiner is an open source Network Forensic Analysis Tool (NFAT) for Windows (but also works in Linux / Mac OS X / FreeBSD). NetworkMiner can be used as a passive network sniffer/packet capturing tool in order to detect operating systems, sessions, hostnames, open ports etc. without putting any traffic on the network. NetworkMiner can also parse PCAP files for off-line analysis and to regenerate/reassemble transmitted files and certificates from PCAP files. NetworkMiner makes it easy to perform advanced Network Traffic Analysis (NTA) by providing extracted artifacts in an intuitive user interface. The way data is presented not only makes the analysis simpler, it also saves valuable time for the analyst or forensic investigator. NetworkMiner has, since the first release in 2007, become a popular tool among incident response teams as well as law enforcement. NetworkMiner is today used by companies and organizations all over the world. Free edition features Live sniffing Parse PCAP files IPv6 support Extract files from FTP, TFTP, HTTP, HTTP/2, SMB, SMB2, SMTP, POP3 and IMAP traffic Extract X.509 certificates from SSL encrypted traffic like HTTPS, SMTPS, IMAPS, POP3S, FTPS etc. Decapsulation of GRE, 802.1Q, PPPoE, VXLAN, OpenFlow, SOCKS, MPLS and EoMPLS Receive Pcap-over-IP Runs in Windows and Linux OS Fingerprinting (*) Click here to visit the author's website. |
 |
3,060 | Mar 25, 2021 Netresec AB 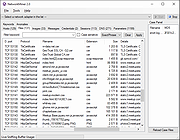 |
|
| NetworkOpenedFiles v1.63 NetworkOpenedFiles v1.63 A simple tool for Windows that displays the list of all files that are currently opened by other computers on your network. For every opened filename, the following information is displayed: Filename, user name, computer name (On Windows 7/2008 or later), Permissions information (Read/Write/Create), locks count, file owner, file size, file attributes, and more... System Requirements This utility works on any version of Windows, starting from Windows XP and up to Windows 11, including Windows Server. Both 32-bit and 64-bit systems are supported. On systems older than Windows 7 or Windows Server 2008, NetworkOpenedFiles doesn't display the name of the computer that opened the files ('Computer' column) Start Using NetworkOpenedFiles NetworkOpenedFiles doesn't require any installation process or additional DLL files. In order to start using it, simply run the executable file - NetworkOpenedFiles.exe After running NetworkOpenedFiles, the main window displays the list of all files that are opened by other computers on your network. You can select one or more opened files, and then close them using the 'Close Selected Opened Files' option, export the files list to text/csv/tab-delimited/xml/html file using the 'Save Selected Items' option, or copy the files list to the clipboard (Ctrl+C) and paste it to Excel or any other spreadsheet application. Display Mode NetworkOpenedFiles allows you to display the opened files in 2 different modes: • Show all entries: In this mode, NetworkOpenedFiles displays all opened files, exactly as they are received from Windows operating system. • Merge items with the same filename+user+computer: In this mode, if there are multiple items with the same filename, user, and computer name - NetworkOpenedFiles merges them into one item. You can change the display mode from Options -> Display Mode. Connecting to a remote computer NetworkOpenedFiles also allows you to connect another computer on your network, ... |
 |
6,451 | Jul 26, 2024 Nir Sofer  |
|
| NetworkTrafficView v2.43 NetworkTrafficView v2.43 A free network monitoring tool that captures the packets pass through your network adapter, and displays general statistics about your network traffic. The packets statistics is grouped by the Ethernet Type, IP Protocol, Source/Destination Addresses, and Source/Destination ports. For every statistics line, the following information is displayed: Ethernet Type (IPv4, IPv6, ARP), IP Protocol (TCP, UDP, ICMP), Source Address, Destination Address, Source Port, Destination Port, Service Name (http, ftp, and so on), Packets Count, Total Packets Size, Total Data Size, Data Speed, Maximum Data Speed, Average Packet Size, First/Last Packet Time, Duration, and process ID/Name (For TCP connections). Changes: v2.43: Fixed bug: NetworkTrafficView randomly crashed when using the GeoLite2 City database. System Requirements • This utility works on any version of Windows, starting from Windows 2000 and up to Windows 11, including 64-bit systems. • One of the following capture drivers is required to use NetworkTrafficView: - Npcap capture driver Npcap is an open source capture driver based on the discontinued WinPcap library that allows you to capture network packets on any version of Windows. You can download and install the Npcap driver from this Web page. - Microsoft Network Monitor Driver version 3.x (Windows Server 2008, Windows XP Service Pack 3, Windows Server 2003 Service Pack 2, Windows Server 2003 Service Pack 2 x64 Edition, Windows Server 2008 R2 for Itanium-based Systems, Windows Server 2008 R2, Windows XP 64-bit, Windows Vista Service Pack 1, Windows Server 2012, Windows 7, Windows 8, Windows Vista 64-bit Editions Service Pack 1 ): Microsoft provides a free capture driver under Windows 2000/XP/2003 that can be used by NetworkTrafficView, but this driver is not installed by default, and you have ... |
 |
9,011 | Mar 31, 2023 Nir Sofer  |
|
| NetworkUsageView v1.31 NetworkUsageView v1.31 Extracts and displays the network usage information stored in the SRUDB.dat database of Windows 8, Windows 10, and Windows 11. The network usage data is collected every hour by Windows operating systems and includes the following information: The name and description of the service or application, the name and SID of the user, the network adapter, and the total number of bytes sent and received by the specified service/application. System Requirements This tools works on Windows 8, Windows 10, and Windows 11. Previous versions of Windows are not supported because the operating system doesn't collect the network usage information. Changes: Version 1.31: Added 'Sort By' toolbar button Start Using NetworkUsageView NetworkUsageView doesn't require any installation process or additional DLL files. In order to start using it, simply run the executable file - NetworkUsageView.exe After running NetworkUsageView - if the SRUDB.dat database file is locked , NetworkUsageView will ask you whether you want to run it as administrator in order to access the locked file. If the file is not locked, NetworkUsageView will load it instantly. 'Advanced Options' Window In the 'Advanced Options' window (F9), you can choose to load the SRUDB.dat database from external drive or from a remote computer on your network. Be aware that loading the network usage information from a remote computer works only when the database file on the remote computer is not locked. You can also choose to load the network usage data from the last xx days hours or from the specified date/time range. NetworkUsageView Columns Record ID: The ID of the record in the SRUDB.dat database. Timestamp: The date/time that this record was created. App Name: The name if the application or service. App Description: The description of application or service. If the 'App Name' is .exe ... |
 |
5,584 | Feb 08, 2024 Nir Sofer  |
|
| Nmap Security Scanner v7.95 Nmap Security Scanner v7.95 A free and open source (license) utility for network exploration or security auditing. Many systems and network administrators also find it useful for tasks such as network inventory, managing service upgrade schedules, and monitoring host or service uptime. Nmap uses raw IP packets in novel ways to determine what hosts are available on the network, what services (application name and version) those hosts are offering, what operating systems (and OS versions) they are running, what type of packet filters/firewalls are in use, and dozens of other characteristics. It was designed to rapidly scan large networks, but works fine against single hosts. Nmap runs on all major computer operating systems, and official binary packages are available for Linux, Windows, and Mac OS X. In addition to the classic command-line Nmap executable, the Nmap suite includes an advanced GUI and results viewer (Zenmap), a flexible data transfer, redirection, and debugging tool (Ncat), a utility for comparing scan results (Ndiff), and a packet generation and response analysis tool (Nping). Features: Flexible: Supports dozens of advanced techniques for mapping out networks filled with IP filters, firewalls, routers, and other obstacles. This includes many port scanning mechanisms (both TCP & UDP), OS detection, version detection, ping sweeps, and more. See the documentation page. Powerful: Nmap has been used to scan huge networks of literally hundreds of thousands of machines. Portable: Most operating systems are supported, including Linux, Microsoft Windows, FreeBSD, OpenBSD, Solaris, IRIX, Mac OS X, HP-UX, NetBSD, Sun OS, Amiga, and more. Easy: While Nmap offers a rich set of advanced features for power users, you can start out as simply as "nmap -v -A targethost". Both traditional command line and graphical (GUI) versions are available to suit your preference. Binaries are available for those who do not wish to compile Nmap from source. Free: The primary ... |
 |
10,129 | Jul 26, 2024 Nmap  |
|
| No Power Save v1.0 No Power Save v1.0 Does your network connection feel rife with problems? for example WiFi keeps dropping the internet connection every 10 minutes or so and the access to the internet is cut off for 10 – 20 secs and then comes back. Or WiFI adapter automatically got disabled and can’t enable without restart . Have you ever noticed that your network connection abruptly quits when your PC sleeps? The 802.11 power save protocol helps your Pc to saves power and increases battery life. You can find this Option under "Wireless Adapter Settings - Power Saving Mode" . "Maximum Performance" mode is the default when plugged into power; it disables the power-saving model. "Medium Power Saving" mode is the default when you’re on battery power. You can also select "Low Power Saving" or "Maximum Power Saving" for either. Microsoft notes that Windows has a power saving feature, but for some brands of wireless network adapters don’t support this feature correctly and you may experience problems when connected to them if it’s enabled. So, if you have Wi-Fi problems, you might want to try disabling it. In theory, the Wi-Fi radio going to sleep more often may increase latency and reduce network performance - but you’ll get more battery life. How to fix wifi connectivity issues 1. Uncheck "Allow the computer to turn off this device to save power." in Power Management tab of the Network Adapter Properties 2. Change Power Saving Mode of Wireless Adapters to Maximum performance To change both of them easily just use the portable freeware tool "No Power Save" , Download it Unzip and run it that's all. YOU MUST RESTART COMPUTER TO APPLY CHANGES. Can cause issues with Wake On Lan. Disable it if using this tool. The password for the embedded zip file is "sordum". Click here to visit the author's website. |
 |
4,184 | Jul 26, 2019 Sordum.org  |
|
| NUTs - Network Utility Tools v2.1 NUTs - Network Utility Tools v2.1 Free and open source tool to allow you to display and configure your computer's network settings in just a few clicks. Tired of typing commands to view your network settings ? Tired of opening many windows to change your IP address ? With NUTs, it's a thing of the past ! NUTs allow you to display and configure your computer's network settings in just a few clicks. NUTs is a tool that allows you to easily show and modify your network settings. With it, you no longer need to go through the Command Prompt or open lots of windows to access the network settings. Everything is centralized to save your time and your energy ! With the v2.0, you can launch commands like PING or TRACERT. Click here to visit the author's website. |
 |
1,802 | Dec 08, 2022 Louis Dolbecq  |
|
| NxFilter v4.5.4.1 NxFilter v4.5.4.1 A freeware web-filter designed for enterprise environments. It started as a dns-filter. Now it provides web-proxy based filtering as well. NxFilter can do everything you can expect from a dns-filter or a web-filter. Faster and lighter Filtering requires an extra process for your network. It can be a bottle neck in your network and cause a latency problem. NxFilter uses lightweight DNS protocol for its filtering. There will be no latency problem from NxFilter. Network performance NxFilter doesn’t just do filtering. It caches DNS responses from public DNS servers. Once it cached, it will be resolved in your local network. It will save you a lot of bandwidth and improve your network performance. Scalability We see many sites running NxFilter for several thousand users. At the moment, the biggest number of users for a single NxFilter server we have seen is 60,000. We don’t know its limit yet. Authentication You want to protect your network with a login procedure and differentiate users with userames and IP addresses on your report view. NxFilter offers IP and password based authentication by itself. Active Directory integration You can import users and groups from an Active Directory domain and you can filter them by multiple policies based on those imported groups and users. Single sign-on Your users don’t want to go through any other login process after they logged in to their PCs. NxFilter provides several kinds of single sign-on agents. Some of them can be used for Active Directory integration. Multiple policies You can have multiple policies for your users. One policy for staffs and a stricter policy for your students. You can apply these policies based on IP and IP ranges or users and groups created on NxFilter GUI or imported from your Active Directory domain. Easy deployment You can say that NxFilter is the easiest webfilter to install and manage. Many of our users are ... |
 |
6,803 | Jan 27, 2022 Jahastech  |
|
| OandO Lanytix v1.0.1340 OandO Lanytix v1.0.1340 Quick and easy Network Analysis in the LAN OandO Lanytix is a portable application that enables quick and easy analysis of the local network (LAN = Local Area Network) at the push of a button. This not only enables devices in the network to be recognized, but also their properties such as IP address, MAC or the manufacturer of the network card. Features Search and detection of devices in the local network (LAN) Determination of name, IP address, MAC, operating system, manufacturer of the network card, response times Logging of search results Possibility to export search results Free System requirements Windows 8 or higher Microsoft .NET Framework 4.7.2 or higher Portable, therefore no installation necessary Available in German, English and French If you’ve always wanted to know which devices actually exist in your network, you can find out very quickly and easily with OandO Lanytix. For this purpose, the local network is searched for devices and corresponding properties such as IP address or MAC (= unique hardware address) are determined. Response times, the operating system and the manufacturer of the network card can also be read. OandO Lanytix helps identify devices that may have been unknown or not noticed before. It can also help in the discovery of new devices that may not even belong in the local network. A history is kept for all devices so that you can see when a device was recognized first and when it was last recognized. If the settings of a device change (e.g. the IP address), this is also logged. Version 1.0.1340 – released on June 15, 2021 NEW: Deletion of scan history integrated ... |
 |
3,531 | Jun 16, 2021 O&O Software GmbH  |
|
| Open Visual Traceroute v2.0.0 Open Visual Traceroute v2.0.0 Open source cross-platform (Windows/Linux/Mac) Java Visual Traceroute Data is displayed in a 3D or a 2D map component. Features Traceroute Whois 3D and 2D Map visualisation Export data to image or text Gantt view Release note from the author Version 2.0.0 Starting version 2.0.0, I decided to deprecate the sniffer features and refocus the tool to its original purpose: a visual traceroute. Reasoning around the decision were ultimately time to maintain the application while the various libraries it depends on were being upgraded to non compatible APIs or plainly deprecated. This decision will also make the application runnable without admin privilege and external software required to be installed (except Java), which was one of the pain point in the installation of versions 1.7 and prior. This download is for the Windows portable version. All other download assets are below: Windows: OpenVisualTraceroute2.0.0.exe MacOS: OpenVisualTraceRoute2.0.0.dmg Linux: ovtr_2.0.0-1_amd64.deb ovtr_2.0.0-1_i386.deb ovtr-2.0.0-1.x86_64.rpm ovtr-2.0.0-1.i386.rpm Click here to visit the author's website. |
 |
5,648 | Jan 04, 2022 Leo Lewis 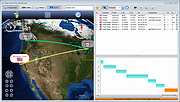 |
|
| Pandora FMS v7.0NG765 Pandora FMS v7.0NG765 Open Source Monitoring System for performance and availability. Pandora FMS is an enterprise-ready monitoring solution that provides unparalleled flexibility for IT to address both immediate and unforeseen operational issues, including infrastructure and IT processes. It uniquely enables business and IT to adapt to changing needs through a flexible and rapid approach to IT and business deployment. Pandora FMS consolidates all the needs of modern monitoring (ITOM, APM, BAM) and provides status and performance metrics from different operating systems, cloud, virtual infrastructure (VMware, Hyper-V, XEN), Docker containers, applications, storage and hardware devices such as firewalls, proxies, databases, web servers or routers. It's highly scalable (up to 2000 nodes with one single server), 100% web and with multi-tenant capabilities. It has a very flexible ACL system and several different graphical reports and user-defined control screens. Features Network monitoring WMI monitoring Server monitoring (for all OS) Graphical reporting, based on it's own SQL backend SLA and KPI metrics on reporting Application performance management Optional Enterprise edition with professional support and enterprise-ready features Inventory management WYSIWYG Visual Console screens and Dashboards Scales to thousands of devices Multi-tenant, several layers of access control GIS tracking and viewing Multicloud monitoring This download is for the Windows 64bit agent version. All other download assets are below: Windows: Pandora FMS Windows Agent v7.0NG.765_x86.exe (32bit agent) RHEL_CentOS: pandorafms_agent_unix-7.0NG.765.noarch.rpm pandorafms_server-7.0NG.765.noarch.rpm pandorafms_console-7.0NG.765.noarch.rpm Tarball: pandorafms_agent_unix-7.0NG.765.tar.gz pandorafms_server-7.0NG.765.tar.gz pandorafms_console-7.0NG.765.tar.gz Click here to visit the author's website. |
 |
1,784 | Oct 14, 2022 Pandora FMS 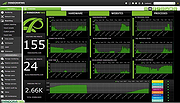 |
|
| Ping Alert v5.6 Ping Alert v5.6 Setup any number of consecutive PING loss to get alert - PING monitor your internet or LAN servers with SMS / Mail / Sound alerts when get consecutive PING loss. Setup consecutive 1 or 2 or 3,..10..20..100.... ping loss to send you alert Alert you once only when PING normal -> PING consecutive loss -> PING normal status changed - It does not keep sending you alerts when it remains PING loss. Let you know when it is abnormal and when it is back exactly. Alerts include SMS, Email and Sound. SMS and Email alerts send out from our server and has option to email additional alert via Local/ Gmail/ Yahoo/ Hotmail SMTP server at the same time to ensure you can receive alerts independent of our servers. I am Alive mail notification - Has option to setup mailing you the current monitoring log periodically to let you know monitoring program is up and running Save PING loss data to log file and separate the log files by date automatically. Different alert text for different host - Set up different text for different host alert message Allow to limit SMS sending a day - Cap # of SMS sending to avoid large SMS alert when abnormal situation happened. if you set max. # is 10 then the 10th SMS will have 10/10 in the end. No SMS alert but you still can get mail alert. Counter will be reset at 00:00 to let you get SMS alert next day Not only monitor PING timeout but also monitor all other PING situation - Also include host is "Request Time Out","Dest Network ... |
 |
5,884 | Dec 29, 2020 SMS4Mail 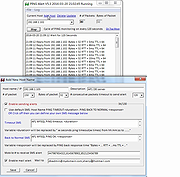 |
|
| Ping GUI v1.1.0.3 Ping GUI v1.1.0.3 PingGUI is a tool to ping one or multiple ip addresses and websites. Multiple destinations can be pinged simultaneously. The ping time will be shown in a graph and as text. Features: - ping ip addresses and websites - ping multiple destinations simulaneously - scan ip address range like 192.168.178.* - destinations can be saved in a list - timeout value can be entered - ping times (roundtrip) are shown in a graph and as text - destination(s) can be pinged continuously (a delay time can be entered) - connections can be kept alive - a trace route (tracert) can be done on multiple hosts by 1 click - an ip configuration (ipconfig) can be done by 1 click - results can be written to text or cvs file - using the settings window the default settings can be changed such as window size Version 1.1.0.3 - changed: new executable compiled to reduce the number of false positives - improved: minor optimization Click here to visit the author's website. |
 |
5,391 | Dec 16, 2019 Peter Verbeek 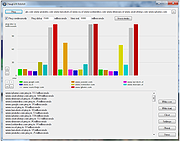 |
|
| Ping Monster v1.8 Ping Monster v1.8 This is a freeware ping monitor tool, with some alert actions like: send email, sound alert, http post. Features ICPM Ping monitoring hosts Config time interval between pings Email Alert Sound Alert HTTP Post Alert Log file Click here to visit the author's website. |
 |
5,687 | Mar 20, 2019 Eduardo Zola 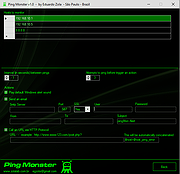 |
|
| Ping Tracer v1.9 Ping Tracer v1.9 Ping Tracer continuously pings each network host between your computer and a given destination, helping identify the source of connectivity problems. This program helps to visually determine the origin of connection problems. The latency over time is shown on graphs, and each instance of packet loss is marked in red. A common use for such a tool is to monitor your connection to a multiplayer game server so you know who to blame when you experience lag. For example, if you experience a terrible moment of lag and you see that every node beyond your router is showing elevated latency or packet loss, then the lag was on your end. Typically, a poorly performing node will affect your connection to every node after it. I built this program for personal use, and decided to share it for free as an open source project. As such, it is light on features and polish. Something you should be aware of is that when you attempt to "Graph every node leading to the destination", a trace route operation is performed in order to discover the hosts that will be monitored. The trace route operation is not optimized for speed, and will take many seconds to complete in most cases. The trace route operation attempts to contact each host (a.k.a. network node) only once. Any host that fails to respond during the trace route operation will not be monitored. The trace route operation is ended if 5 consecutive hosts fail to respond. This usually indicates that the destination host was already passed by and did not respond to the trace ping. Some hosts respond to the traceroute but do not respond to direct pings. Technically it would still be possible to monitor these ... |
 |
2,931 | Mar 04, 2021 bp2008 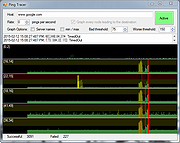 |
|
| PingHurry v1.2.2.0 PingHurry v1.2.2.0 PingHurry is a free visual ping tool with a flat and 3D graph window or console list overview. If your job requires to do connectivity checks several times a day, then this is the right tool for you. With PingHurry a ping/trace/reverse lookup/TCP port scan task is one hotkey away, just show/hide the PingHurry window by using the hotkey or system tray icon. It has several other features like zooming in the flat graph, IPconfig info, flush dns and a built-in TCP Port scanner (New) etc…. See the feature list for a complete overview. Scope of this utility: – Ping utility with great accessibility to work faster. – People who run connectivity checks several times a day. – Network administrators and power users. Features: – Ping results in 3D/flat graph with zoom function. – Ping results in command view window. – Several target tasks like trace/reverse lookup/RDP. – Several local tasks like IPconfig/flush dns/route table info etc…. – Target autocomplete with 50 previous valid targets. – Export Graph/Results to clipboard. – Export all results to notepad (last 24H) or filter failed or ping times higher than a certain time. (New 1.2.2.0) – Custom timeframe and ping interval. – Quick access to built-in Windows tools. – System tray application. – Autostart. – Keyboard hotkey can be enabled. – Custom hotkeys. – Free utility. – Portable version available. – TCP Port scanner + TCP Port list viewer. – Advanced Target History. – Custom target button to launch the process of your choice with the arguments you want, launch for example VNC. – New Target button Browser. – Customizable on top feature. Required: Microsoft .NET Framework 4 or higher OS: Windows 7/8/8.1/10 Version History PingHurry New feature Dec-2015 1.2.2.0 Export to Notepad updated with export complete/failed/custom ping times last day |
 |
7,307 | May 05, 2019 Adminscope 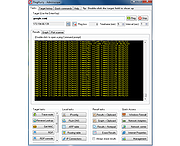 |
|
| PingInfoView v3.20 PingInfoView v3.20 A small utility that allows you to easily ping multiple host names and IP addresses, and watch the result in one table. It automatically pings to all hosts every number of seconds that you specify, and displays the number of succeed and failed pings, as well as the average ping time. You can also save the ping result into text/html/xml file, or copy it to the clipboard. System Requirements This utility works under Windows 2000, Windows XP, Windows Server 2003, Windows Server 2008, Windows Server 2012, Windows Server 2016, Windows Vista, Windows 7, Windows 8, Windows 10 and Windows 11. Changes: v3.20 Added 'Black Background' option (Under the View menu). When it's turned on, the main tables are displayed in black background and white text, instead of default system colors. Added 'Mark Odd/Even Rows' option. Using PingInfoView PingInfoView doesn't require any installation process or additional dll files. In order to start using it, simply run the executable file (PingInfoView.exe), type the host names and IP addresses that you want to ping, and click the 'Ok' button to start pinging. Known Issues If you ping to a lot of hosts concurrently, PingInfoView may return a failed result to some of the hosts, even if the hosts are ok. In order to solve this issue, go to the 'Advanced Options' and decrease the maximum number of concurrent pings. Use IP-Host Description format When this option is selected, you should specify the IP addresses list in the following format: 192.168.1.10 Main Server 192.168.1.11 Host 01 192.168.1.12 Host 02 #192.168.1.14 Host 03 The description of each IP address is automatically added to the description column. If you add '#' character in the beginning of the line, PingInfoView will ignore it. Command-Line Options /stext <Filename> Make a single ping test and save the result into a simple ... |
 |
9,968 | Feb 23, 2025 Nir Sofer  |
|
| PingoMeter v0.9.4 PingoMeter v0.9.4 PingoMeter - is a small program that show your ping in Windows system tray. Click here to visit the author's website. |
 |
3,280 | Aug 26, 2020 Igor Eflfe  |
|
| Port Alert v5.4 Port Alert v5.4 Why monitoring TCP ports - Server services such as FTP Server is using TCP port 21, SSH server port 22, TELNET server(23), SMTP Server(25), DNS server(53), Http server(80), POP3 server(110), IMAP server(443), MS SQL(1433), Oracle server(1521), MYSQL server(3306) or self defined port #. TCP Ports are numerical identifiers in host to host communications. Monitoring TCP port # is monitoring these services. Technical Article on ghacks.net for the Port_Alert software Setup any # of consecutive connection timeout to alert you at the RIGHT time - Monitoring TCP ports and alert you only when the TCP ports connect timeout on a continuous time period. You can setup any # of consecutive 1 or 2 or 3,...10.. or..20..100.. connect timeout to send you alerts. Setup a small # to alert you when the server connect timeout for bad performance before it goes down or a big # at the server down with no false alert. Easy to monitor your internet or local TCP applications "Enable sending mail alerts via 2nd SMTP server" - Mail will be sent out from our mail server and has option to send out from your own or public SMTP server such as Yahoo, Hotmail ..etc at the same time to let you get mail alerts independent of our server. Save timeout detail information to log file and separate the logs file by date automatically. Alert you once only - Alert you when the # of consecutive timeout # reached. No keep sending you alerts when it keeps connection timeout. Alert once again when it back to normal Allow to limit maximum SMS sending a day - Cap maximum # of SMS sending a ... |
 |
5,920 | Dec 05, 2018 SMS4Mail 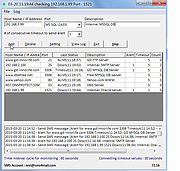 |
|
| PortChecker 1.0 PortChecker 1.0 PortChecker is a free tool that you can use to check if a certain UDP or TCP port is open or not. Requirements: .NET Framework v4.6 |
 |
6,174 | Nov 12, 2015 CodeDead 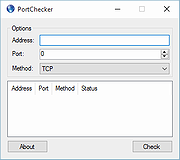 |
|
| PortExpert v1.8.1.20 PortExpert v1.8.1.20 PortExpert gives you a detailed vision of your personal computer cybersecurity. It automatically monitors all applications connected to the Internet and gives you all the information you might need to identify potential threats to your system. Features Monitor of application using TCP/UDP communications User-friendly interface Identifies remote servers (WhoIs service) Allows to open containing folder of any applications Allow to easily search for more info online Automatic identification of related service : FTP, HTTP, HTTPS,... Capability to show/hide system level processes Capability to show/hide loopbacks Time freeze function Click here to visit the author's website. |
 |
4,392 | Oct 03, 2020 KC Softwares  |
|
| PortScan and Stuff v1.93 PortScan and Stuff v1.93 Scan and identify network devices Find all active devices on your network. Discover the ip address and available services for each network device. Run a speed test to check your internet connection speed. Ping and Traceroute devices. Query WhoIs and DNS server about domain names ip addresses. PortScan offers similar and more functionality than the Network Utility on macOS. Scan Ports PortScan shows all open ports and additional information like host name, MAC address, HTTP, SMB, FTP, iSCSI, SMTP, SNMP, MySQL and MongoDB services. Up to 100 threads are used for scaning large ip address ranges. Search Devices You can search for UPnP enabled devices, Bonjour services, Netgear router, Synology NAS devices, Buffalo NAS devices, Asus routers, Miracast devices, Epson projectors, Samsung printer, HP printer (SLP / Service Location Protocol), MSA network devices, Sierra Monitor network devices, Freecom network devices and IPv6 devices. So you can find them even if you don’t know the ip address. Ping Devices Ping any computer with 3 standard sized ping packets, with 3 different sizes, each 10 times or ping the computer continuously. A graph shows the distribution of response times. Speed Test Test your internet connection speed by downloading and uploading data to various servers. Also a latency test is included. Supported Languages: English French German Greek Italian Portuguese Russian Simplified Chinese Swedish Turkish Ukrainian Changes: Version 1.93 New: mDNS support in Windows 10 added History Click here to visit the author's website. |
 |
10,846 | Aug 24, 2023 The SZ  |
|
| PowerPing v1.3.3 PowerPing v1.3.3 Open source, advanced command-line ping tool for Windows. Small improved command line ICMP ping program lovingly inspired by windows and linux, written in C#. Note: Requires Elevated Rights (Administrator) to Run Features PowerPing contains the following features (with more to come...): Basic ping functionality Coloured output Display options ICMP packet customisation Scanning Flooding ICMP packet capture (/listen) IP location lookup Whois lookup Graphing Changes Version 1.3.3 Latest Jan 15, 2021 Added milliseconds to full timestamp (#118) Added average response time to graph mode Changed text on user prompt to make it clearer when PowerPing is exiting Fixed address not being found when entered as first argument This download is for the 64bit version. If you need the 32bit version, download here. Click here to visit the author's website. |
 |
5,400 | Jan 04, 2022 Matthew Carney  |
|
| ProcessTCPSummary v1.22 ProcessTCPSummary v1.22 A simple tool for Windows that displays a summary of all process that have TCP connections or listening UDP ports. For every process, this tool displays the total number of TCP connections, number of TCP connections for each status (Established, Listening, Syn-Sent, Syn-Received...), number of IPv4 TCP connections, number of IPv6 TCP connections, common port numbers, and more... If you run ProcessTCPSummary as Administrator, you can also watch the number of TCP/UDP bytes sent and received by every process as well as the current send/receive speed. System Requirements This tool works on any version of Windows, starting from Windows XP and up to Windows 11. Both 32-bit and 64-bit versions of Windows are supported. On Windows Vista and later, if you want to view the full path of system processes or you want to view the sent/reveived bytes information , you have to run ProcessTCPSummary as Administrator. Changes: Version 1.22: Fixed bug with the 'Mark Odd/Even Rows' option. Start Using ProcessTCPSummary This utility doesn't require any installation process or additional DLL files. In order to start using it, simply run the executable file - ProcessTCPSummary.exe After running ProcessTCPSummary, the main window displays a summary of TCP connections for every process. Command-Line Options /cfg <Filename> Start ProcessTCPSummary with the specified configuration file. For example: ProcessTCPSummary.exe /cfg "c:\config\pts.cfg" ProcessTCPSummary.exe /cfg "%AppData%\ProcessTCPSummary.cfg" /RunAsAdmin Runs ProcessTCPSummary as administrator. /stext <Filename> Save the process TCP Summary into a simple text file. /stab <Filename> Save the process TCP Summary into a tab-delimited text file. /scomma <Filename> Save the process TCP Summary into a comma-delimited text file (csv). /sjson <Filename> Save the process TCP Summary into a JSON file. /shtml <Filename> Save the process TCP Summary into HTML file (Horizontal). /sverhtml <Filename> Save the process TCP Summary into HTML file (Vertical). /sxml <Filename> Save the process TCP Summary into XML file. /sort <column> This command-line option can ... |
 |
5,513 | Oct 18, 2024 Nir Sofer  |
|
| Real Network Monitor 1.4 Real Network Monitor 1.4 Real Network Monitor is a professional solution to monitor internet traffic information and statistics. Features: Auto-Run feature Stores all downloaded and uploaded rates by day / month / year of all applications with many formats as Megabytes and Gigabytes Auto-Update and Auto-Select the new connected interfaces Select the interface to see all statistics Desktop monitor function with Windows aero feature if the operating system supports the feature Taskbar monitor function to see statistics inside the Windows taskbar Download / Upload Speed Type / Speed / MAC Adress Maximum Download / Upload Rate Average Download / Upload Speed Downloaded / Uploaded data by connection Total Downloaded / Uploaded data Website Blocker Interfaces Lookup Traffic Database Compatible with all adapters, including DialUP / Bluetooth / Wireless Connections Look at the properties of the current adapter, including DNS and IP Addresses Save all data in an encrypted text file located in the root of the EXE Save the latest inferface selected in the UI for the next runtime See the local IPs and variations with connection by Time Written in English and Portuguęs do Brasil languages Minimize to tray and other UI functions Using Smart Installer Technology for the Setup, one click to install this program Smart Uninstaller will kill all running applications of the program before removal Compatibility: Windows 8 Windows ... |
 |
5,495 | May 24, 2017 Josh Cell Softwares Corporation  |
|
| Router Default Password v1.0 Router Default Password v1.0 Every device connected to a network must have an unique IP address to differentiate it from the others. An IP address is similar to the unique telephone number on your home phone or mobile device. No other device on your network (unless you are using NAT) will have the same IP address. In order for a sending device to transmit data to a receiving device, the sender needs to know where the destination is. The destination will either be on the same subnetwork as the source, or on some other subnetwork. If the devices are in the same subnet, the mechanism used to determine the location of the destination device is the broadcast. But what happens if they are on different networks? This is where the default gateway comes into play. The default gateway is used as the destination of all traffic that is not on the same subnet. You might need to know the IP address of the default gateway if there’s a network problem or if you need to make changes to your router. In Microsoft Windows, the IP address of a computer’s default gateway can be accessed through Command Prompt with the ipconfig command, as well as through the Control Panel. The netstat and ip route commands are used on macOS and Linux for finding the default gateway address. If you haven’t bothered to go in and make changes to your network settings, you may find that you can still access the admin panel using that information. To be able to do that though, you need to know how to find the IP address , default Username and default Password of your router. Here is “Router default Password” Utility come in handy ,it is a Portable freeware. How to use it : 1. Download Router Defauld ... |
 |
5,343 | Jun 28, 2019 Sordum.org  |
|
| ShareWatch v1.0 ShareWatch v1.0 Allows you to see who is connected to a computer and what files they are accessing. Have you ever wondered why your hard drive or modem is active, but you aren't doing anything to cause it to be active? It is possible a remote user is accessing your computer. Have you ever had a file locked but you don't know why? ShareWatch can tell you if a network user is using the file and allows you to disconnect them so that you can edit/delete the file. Have you ever wanted to shutdown a computer, but don't want to drop people using the computer. ShareWatch will show you all resources in use by remote users. Features: Watch shares on local and remote servers. Shows the users and computers that are connected to each share, along with what files are open. Allows you to disconnect any file, user, computer, or share. Address book lookup to show you the details about each user connected (this feature is turned off by default) Computer lookup to show you both the computer name and IP address of the computers connected. Can be run as a tray application. Supports top-most and transparency. Works on Windows Windows 95 - Windows 11. Multithreaded to allow servers to be queried independently from each other while not blocking each other or the user interface. What ShareWatch Can do... ShareWatch only watches folders that are shared out using the Windows folder sharing feature. This is usually how people share files and printers with each other on a home or corporate network. It can watch the shares ... |
 |
2,473 | Nov 15, 2021 Steve P. Miller  |
|
| Simple Bandwidth Monitor v1.1 Simple Bandwidth Monitor v1.1 Simple Bandwidth Monitor will help you monitor your network usage. Here are some key features of Simple Bandwidth Monitor: Realtime graphical display of your network usage Daily and Monthly download and upload statistics Simple Bandwidth Monitor Every 10 sec current statistics are saved to your disk. Rates show you network usage in bits per second (Kilobits or Megabits). |
 |
3,855 | Nov 27, 2019 niliand.com  |
|
| SmartSniff v2.30 SmartSniff v2.30 Capture TCP/IP packets that pass through your network adapter, and view the captured data as sequence of conversations between clients and servers. You can view the TCP/IP conversations in Ascii mode (for text-based protocols, like HTTP, SMTP, POP3 and FTP.) or as hex dump. (for non-text base protocols, like DNS) SmartSniff provides 3 methods for capturing TCP/IP packets : 1) Raw Sockets (Only for Windows 2000/XP or greater): Allows you to capture TCP/IP packets on your network without installing a capture driver. This method has some limitations and problems. 2) WinPcap Capture Driver: Allows you to capture TCP/IP packets on all Windows operating systems. (Windows 98/ME/NT/2000/XP/2003/Vista) In order to use it, you have to download and install WinPcap Capture Driver from this Web site. (WinPcap is a free open-source capture driver.) This method is generally the preferred way to capture TCP/IP packets with SmartSniff, and it works better than the Raw Sockets method. 3) Microsoft Network Monitor Driver (Only for Windows 2000/XP/2003): Microsoft provides a free capture driver under Windows 2000/XP/2003 that can be used by SmartSniff, but this driver is not installed by default, and you have to manually install it, by using one of the following options: • Option 1: Install it from the CD-ROM of Windows 2000/XP according to the instructions in Microsoft Web site • Option 2 (XP Only) : Download and install the Windows XP Service Pack 2 Support Tools. One of the tools in this package is netcap.exe. When you run this tool in the first time, the Network Monitor Driver will automatically be installed on your system. 4) Microsoft Network Monitor Driver 3: ... |
 |
5,126 | Jul 15, 2024 Nir Sofer  |
|
| SnmpWalk (Shell Tool) v1.02 SnmpWalk (Shell Tool) v1.02 SNMP is a unified protocol of network monitoring and network device management. All active network devices support SNMP. Besides that, SNMP is supported by major operational systems and a large number of network applications. SnmpWalk allows you to detect a set of variables that are available for reading on an individual device. You can obtain a full list or just part. By analyzing the results of a network device scan obtained with SnmpWalk, you can develop a list of supported MIBs and, in this way, obtain full descriptions of variables and possible values. Besides that, MIB documents contain information about SNMP variables that are available only for writing. After analyzing information retrieved with SnmpWalk from hardware or software SNMP sources, you can use SnmpSet and SnmpGet tools to change and obtain values. The value of SnmpWalk is not limited to only the SNMP analysis of supported features. This tool can efficiently get SNMP tables and read whole sections of variables. This mainly refers to tables that are often used for presenting statistical and status information. SnmpWalk is a command-line tool, which makes possible its use in scripts. This tool supports modern IPv6 in addition to the standard IPv4. Moreover, SnmpWalk allows you to use a simple version of SNMPv1/SNMPv2c and also supports a safe version of SNMPv3. Features Supports SNMP v1/v2c and SNMPv3 Supports IPv4 and IPv6 Full or partial SNMP variables tree Exports to CSV file Command line interface (CLI) Any type of SNMP variables Various Auth. & Privacy protocols Windows XP-10 compatible Windows Server 2003-2016 compatible Parameters SnmpWalk.exe [-q] -r:host [-p:port] [-t:timeout] [-v:version] [-c:community] [-ei:engine_id] ... |
 |
4,928 | Dec 08, 2019 SNMP Software 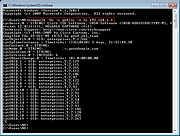 |
|
| sPinger v1.0.1 sPinger v1.0.1 Ping multiple IP addresses and hostnames with fun icon themes. Features: Pseudo multi-threaded. Quickly generate lists of all addresses from a list of subnets. Quickly generate lists of only pingable addresses from a list of subnets (not available on Windows 8/10). DNS scan mode to quickly retrieve hostnames from IP addresses. Fun icon themes in the list to show good, bad, and TTL expired pings. Configurable list — colours, fonts, etc. Supported OS: Windows 7/8/10. Probably works, but not tested, on Windows XP/Vista. Click here to visit the author's website. |
 |
5,499 | Mar 24, 2019 Jody Holmes 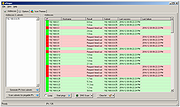 |
|
| SPM-Monitoring v3.6.0.6 SPM-Monitoring v3.6.0.6 Monitoring Tool for your IT Environment This tool will help you to monitoring your office IT environment. It will signals to you, if some hosts are unavailable (or answer time is to long, its "CPU is overloaded", "available RAM is Low", "low logical disks free space", "disks overloaded" or 'network adapters overloaded'). Notifications by E-Mail, SMS, Telegram Bot. Logging. Reporting. Features Hosts availability monitoring (ICMP). Monitoring hosts CPU load, available RAM, Logical Disks free space and load, network adapters load. Windows EventLog events forwarding and host reboot notifications. Agents for Windows and Linux. Web Sites Monitoring (HTTP). E-Mail Notifications support custom templates. SMS Notifications (worldwide). Telegram Notifications (get notifications in your IT chat, logs, uptime stats) (support proxy – роскомнадзор free). Notifications support dependencies, or chains of dependencies (For example don`t need to send notifications for each VMs when its HyperV host is unavailable) Aggregate 'short time sent' emails in one message. Logging. Reporting – Host statistics, uptime, average answer time. ICMP activity Chart. Tray notifycations. Add IP ranges. Can add only available hosts. Import hosts from Active Directory or CSV, export to CSV, export to Excel. Export Reports of an ICMP statistics to CSV and Excel. Host grouping and tagging. Few Visual representation of Host objects. Drag@Drop hosts rearrange and group assigning. Realtime charts of Hosts ICMP Activity. Also you can ask Telegram Bot for hosts status, some host or all hosts in some group. You can run your ... |
 |
2,901 | Mar 07, 2021 Dmitry Koziakov  |
|
| TCP Handshake Connection Tester v2.5.2.1 TCP Handshake Connection Tester v2.5.2.1 Check for completion of the standard TCP 3-way handshake and connection time between a local interface IP address and a target host. TCPConTest.exe also lets you check the selected network interface for IP packet errors. SHA-256: ea2ce65a7e6319fe586e298e8f16dbe457e7c156391019a18e0ec3da586fc060 Minimum system requirements Microsoft Windows 10® 64-bit, Build 18363.1256 • .NET 5.0 Click here to visit the author's website. |
 |
3,208 | Jul 17, 2021 Steve Chaison Software 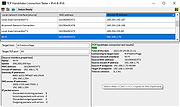 |
|
| TCP Monitor Plus v2.93 TCP Monitor Plus v2.93 A TCP/IP network monitor for Windows. LAN and Internet traffic volume display, IP monitoring, and session status monitoring are possible. It also has functions such as NSLOOKUP, NETSTAT, WHOIS, and communication log file output. It can be resident in the task tray, so it does not get in the way. Supported operating systems Windows 98/Me/NT/2000/XP/Vista/7/8/8.1/10/11 • Functions are limited in some versions of Windows. • This software has been confirmed to work on Windows 11. • Works as a 32-bit application on a 64-bit OS. Changes: Ver2.93 • Layout adjustment on Windows 11 • Other minor fixes Click here to visit the author's website. |
 |
3,637 | Apr 04, 2023 OGA 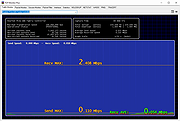 |
|
| TCP/IP Port Scanner 1.5 TCP/IP Port Scanner 1.5 Tcp Port Scanner is the software that helps to find TCP/IP opened ports. It can scan up to 10,000 ports per second. License: Freeware. Installation and use: 1) You must have administrator privileges 2) Install "Tcp Port Scanner\WinPcap\WinPcap.exe" 3) Run "Tcp Port Scanner\Bin\TcpScanner.exe" Attention: The Program does not work with PPP/PPPoE/PPTP/L2TP connection directly (Modem, ADSL, WiFi, VPN) . You need to install the router and configure it for PPP/PPPoE/PPTP/L2TP connection, then connect computer to router by network cable. If program does not work or work very slow, then you must disable all firewalls, antiviruses and ndis filters. |
 |
6,004 | May 04, 2016 S.K. Software 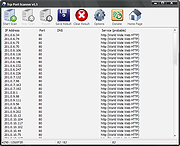 |
|
| TCPConnectProblemView v1.05 TCPConnectProblemView v1.05 A free tool for Windows that monitors the TCP connections on your system and displays an alert when a software tries to initiate a TCP connection and there is no response from the server. When a problem with a TCP connection is detected , TCPConnectProblemView adds a new entry with the following information: Process Name, Process ID, Detected On (date/time), Local Port, Local IP, Remote Port, Remote IP, Remote Host. TCPConnectProblemView also allows you to automatically close any TCP socket with no response from the server, in order to decrease the time you wait for any software to display an error message (IPv4 only). System Requirements This tool works on any version of Windows, starting from Windows XP, and up to Windows 11. Both 32-bit and 64-bit systems are supported. Changes: v1.05: Added 'Always On Top' option. Start Using TCPConnectProblemView TCPConnectProblemView doesn't require any installation process or additional DLL files. In order to start using it, simply run the executable file - TCPConnectProblemView.exe After running TCPConnectProblemView, the main window displays the list of TCP conection problems when they are detected. In order to check if TCPConnectProblemView really works on your system, simply open your Web browser, type any inactive IP address on your LAN (For example: https://192.168.0.200 ), your Web browser will try to connect this address, and then short time after there is no response from the server, TCPConnectProblemView will display an alert about the problem. It's possible that you'll see multiple alerts because Web browsers usually try to connect multiple times before displaying failure error message. Tray Icon In order to put the TCPConnectProblemView tool on the tray icon, simple enable the 'Put Icon On Tray' option (Under the Options menu) and then close the main window. If you want to get an alert in a tray balloon when a TCP ... |
 |
2,675 | Aug 04, 2022 Nir Sofer  |
|
| TcpLogView v1.41 TcpLogView v1.41 A simple, free utility that monitors the opened TCP connections on your system, and adds a new log line every time that a TCP connection is opened or closed. For every log line, the following information is displayed: Even Time, Event Type (Open, Close, Listen), Local Address, Remote Address, Remote Host Name, Local Port, Remote Port, Process ID, Process Name, and the country information of the Remote IP (Requires to download IP to country file separately.) System Requirements and Limitations This utility works on any version of Windows, starting from Windows 2000 and up to Windows 11. On 64-bit systems, you should use the x64 build of TcpLogView. This utility creates the TCP log by taking a snapshot of currently open TCP connections, and comparing it to the previous snapshot. This means that if a TCP connection is opened for a very short time, then TcpLogView will not be able to capture it. On Windows Vista/7/8 with UAC turned on, you should run TcpLogView as administrator if you want to get full process information. Changes: Version 1.41: Added 'CaptureInterval' value to the .cfg file. This value determines the number of milliseconds that TcpLogView waits before taking the next TCP connections snapshot. The default interval is 100 milliseconds (In previous versions it was 250 milliseconds). You can manually decrease this value if you want to capture TCP connections opened for very short time. Start Using TcpLogView TcpLogView doesn't require any installation process or additional dll files. In order to start using it, simply run the executable file - TcpLogView.exe After running TcpLogView, it starts logging the TCP connections, and adds a new line every time that TCP connection is opened or closed. You can clear the current log by using ... |
 |
6,904 | Dec 20, 2023 Nir Sofer  |
|
| TcpTerminal v1.1.2 TcpTerminal v1.1.2 A free tool for testing and debugging TCP communication. Features • Works both as a server and as a client. • Accepts input and prints output in HEX and ASCII format. • Separate display of sent and received data. • SSL support for client connection. Changes 2024/11/08 - v1.1.2 [FIX] Server properly clean its state after client disconnects. [MOD] UI fixes and improvements. Click here to visit the author's website. |
 |
129 | Nov 19, 2024 Elvedin Hamzagic  |
|
| TCPView v4.14 TCPView v4.14 TCP connection analysis TCPView is a Windows program that will show you detailed listings of all TCP and UDP endpoints on your system, including the local and remote addresses and state of TCP connections. TCPView also reports the name of the process that owns the endpoint. TCPView provides a more informative and conveniently presented subset of the Netstat program that ships with Windows. Using TCPView When you start TCPView it will enumerate all active TCP and UDP endpoints, resolving all IP addresses to their domain name versions. You can use a toolbar button or menu item to toggle the display of resolved names. TCPView shows the name of the process that owns each endpoint, including the service name (if any). By default, TCPView updates every second, but you can use the Options|Refresh Rate menu item to change the rate. Endpoints that change state from one update to the next are highlighted in yellow; those that are deleted are shown in red, and new endpoints are shown in green. You can close established TCP/IP connections (those labeled with a state of ESTABLISHED) by selecting File|Close Connections, or by right-clicking on a connection and choosing Close Connections from the resulting context menu. You can save TCPView's output window to a file using the Save menu item. Using Tcpvcon Tcpvcon usage is similar to that of the built-in Windows netstat utility: Usage: cmd tcpvcon [-a] [-c] [-n] [process name or PID] Using Tcpvcon Parameter Description -a Show all endpoints (default is to show established TCP connections). -c Print output as CSV. -n Don't resolve addresses. Runs on: Client: Windows 8.1 and higher. Server: Windows Server 2012 and higher. This download is for the Microsoft version. If you need the portableapps version, download here. Click here to visit the author's website. |
 |
2,700 | Aug 19, 2021 Mark Russinovich 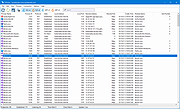 |
|
| Termshark v2.4.0 Termshark v2.4.0 A terminal UI for tshark, inspired by Wireshark Termshark is a simple terminal user-interface for tshark. Why? • You're debugging on a remote machine and need to study a pcap. • You don't want to copy it back to your desktop. • You're familiar with Wireshark. Features • Read pcap files or sniff live interfaces (where tshark is permitted) • Filter pcaps or live captures using Wireshark's display filters • Reassemble and inspect TCP and UDP flows • View network conversations by protocol • Copy ranges of packets to the clipboard from the terminal • Written in Golang, compiles to a single executable on each platform - downloads available for Linux, macOS, BSD variants, Android (termux) and Windows Changes: 51e7457 A function to provide a list of Wireshark profiles 5a37f65 A new tree iterator that disregards expanded and contracted nodes 4eea46b A screenshot of search in action d0e1859 A search implementation for termshark 1b73b61 Abstract this simple confirmation function 0399719 Add a command and menu option to view the termshark config a5f9cd4 Add a new termshark filter state 8d67241 Add a short summary of packet search to the ChangeLog b9aefce Add a summary of stderr to the dialog displayed when tshark fails 7601e01 Add an extra token to each line of stderr from termshark processes efaeaa3 Add information on the packet search feature to the user guide 9b5a9ac Add missing minibuffer commands to the docs 3657975 Add note on tshark -G folders use d950730 Add profile suppport to the ChangeLog f48fcfd Add profiles to the table of contents 18a9e55 Add search to the main menu 37ec8df Add some documentation on the new profile support 15ef1fb Bug fix - the client and server packet counts were not being updated 5323696 Bug fix for conversations ... |
 |
4,700 | Jun 13, 2023 Graham Clark  |
|
| The Dude Network Monitor v7.11.2 The Dude v7.11.2 Network Monitor An application which can dramatically improve the way you manage your network environment. It will automatically scan all devices within specified subnets, draw and layout a map of your networks, monitor services of your devices and alert you in case some service has problems. Some of its features Auto network discovery and layout Discovers any type or brand of device Device, Link monitoring, and notifications Includes SVG icons for devices, and supports custom icons and backgrounds Easy installation and usage Allows you to draw your own maps and add custom devices Supports SNMP, ICMP, DNS and TCP monitoring for devices that support it Individual Link usage monitoring and graphs Direct access to remote control tools for device management Supports remote Dude server and local client Runs in Linux Wine environment, MacOS Darwine, and Windows Documentation https://wiki.mikrotik.com/wiki/Manual:The_Dude Changes https://mikrotik.com/download/changelogs Click here to visit the author's website. |
 |
6,619 | Nov 07, 2023 MikroTik 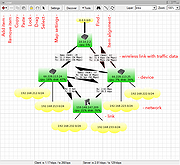 |
|
| TraceRouteOK v3.46 TraceRouteOK v3.46 Track the path that your data travels over the WWW, internet, or the local network. There are many programs of this type, but this is optimized for fast list of data track and quick query of the data route. This free tool shows you the IP address and the corresponding computer ergo host name for all nodes, and measuring transit delays. This can also help you to identify incorrect routing of the data in local network and to see some information about network infrastructure. This Network Utility is good for administrator to identify incorrect routing or for curious users who want to know where and how your data from the Internet come to you. For portable use, please create in the TraceRouteOK working directory TraceRouteOK.ini Features: • Very small program • Variable host name query time • Selectable timeout for pings • Very fast data route query • Portable • Multilingual Installation: TraceRoute does not require installation, can easily be launched from the desktop with no installation and is ready to use on all Windows operating systems. Employment: Operating systems: Windows 11, Windows 10, Windows 10 Pro, Windows 10 Enterprise, Windows 10 Home, Windows 8.1, Windows 8.1 Enterprise and Pro, Windows 8, Windows 8 Enterprise and Pro, Windows 7, Windows 7 Enterprise, Windows 7 Home Basic, Windows 7 Home Premium + Professional, Windows 7 Starter + Ultimate, , X64, x86 and x32 all Windows, MS Windows Server 2019, 2016,2012. Changes: v3.46 // 4 February 2025 • New: Optional uninstallation function and automatic update function. • Updating the language files in the Trace-Route-OK application for Windows. This download is for the 64bit version (very bottom of page). If you need the 32bit version, download here. Click here to visit the author's website. |
 |
5,485 | Feb 07, 2025 Nenad Hrg 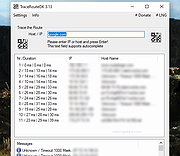 |
|
| Tray Host Checker v1.0.3 Tray Host Checker v1.0.3 Tiny application which periodically pings a configured hostname or IP address and displays a tray icon to show success or failure. Installation: Unzip TrayHostChecker.zip to its own folder and run TrayHostChecker.exe. v1.0.2 - 2017-07-03 + Added alerting options to up and down events. (Thanks, webfork) * Moved "Enable host checking" option to the "Host" section. |
 |
5,271 | Dec 31, 2018 Jody Holmes  |
|
| TrueIP v2.1.0.1 TrueIP v2.1.0.1 A small program that runs in the system tray, monitoring your IP address(es). With the click of the mouse, you can view information about your current IP address and hostname. If you have a computer that you need access to remotely but don’t have the resources to have a static ip address, this program will help you stay connected easily. Features: • Tracks internal and external IP addresses • Notifications when your IP changes including E-mail, FTP, pop up notification, launching an external application, posting to a custom URL, and a free online service provided by HazteK Software called TrueIP Online • Log your recent IP addresses for review at a later date • Runs in the system tray wasting no space and using minimal resources (relative to other full featured .NET applications) • Works with many Dynamic DNS providers to update your DNS records when your IP changes • Portable Prerequisites The following items are required for TrueIP to run properly. • .NET Framework Supported/Tested Operating Systems The following operating systems are supported for running TrueIP. • Windows XP • Windows Vista • Windows 7 • Windows 8 • Windows 8.1 • Windows 10 • Windows 11 • Linux Generic This download is for the Windows portable version. If you need the Windows installer version, download here. If you need the Linux Script, download here. Click here to visit the author's website. |
 |
5,343 | Mar 19, 2023 Joey Hazlett  |
|
| Tweaking.com - Remote Desktop IP Monitor & Blocker Portable Version v1.0.0 ==Official Mirror== Tweaking.com - Remote Desktop IP Monitor and Blocker Portable Version v1.0.0 For Windows XP, 2003, Vista, 2008, 7, 8 & 2012 (32 & 64 Bit) I made this program after seeing brute force attacks on a customers server who had remote desktop enabled and open to the internet. The attacks were trying to brute force the password for the administrator account. The Windows Event Viewer was not showing which IP address the connections were coming from. They were also coming from multiple locations and hitting at random times during the day and night. So tracking them down with the built in Windows tools was going nowhere. So I decided to make a tool that will monitor and log any IP that hits the remote desktop and to be able to block those IP's. This free program will monitor the remote desktop port using the Windows netstat API and keep them in a log for later viewing. The program has a built in block IP tool to easily block any IP address. It does this by using the built in Windows IP Security Policy (IPSec). It can only block IP's, but it can not unblock them. To unblock them I have included a guide here: How to remove IP's from the Windows IP Security (IPSec) Added by the Tweaking.com - Block IP Tool How to remove IP's from the Windows IP Security (IPSec) Added by the Tweaking.com - Block IP Tool Even though this tool was built for watching the remote desktop port you can use it to watch any single port on the system. So if you have another kind of server running and the port open to the internet you can now log any IP that hits it. |
 |
9,050 | Dec 21, 2013 Tweaking.com |
|
| Tweaking.com - Remote Desktop IP Monitor & Blocker v1.0.0 ==Official Mirror== Tweaking.com - Remote Desktop IP Monitor and Blocker v1.0.0 For Windows XP, 2003, Vista, 2008, 7, 8 & 2012 (32 & 64 Bit) I made this program after seeing brute force attacks on a customers server who had remote desktop enabled and open to the internet. The attacks were trying to brute force the password for the administrator account. The Windows Event Viewer was not showing which IP address the connections were coming from. They were also coming from multiple locations and hitting at random times during the day and night. So tracking them down with the built in Windows tools was going nowhere. So I decided to make a tool that will monitor and log any IP that hits the remote desktop and to be able to block those IP's. This free program will monitor the remote desktop port using the Windows netstat API and keep them in a log for later viewing. The program has a built in block IP tool to easily block any IP address. It does this by using the built in Windows IP Security Policy (IPSec). It can only block IP's, but it can not unblock them. To unblock them I have included a guide here: How to remove IP's from the Windows IP Security (IPSec) Added by the Tweaking.com - Block IP Tool How to remove IP's from the Windows IP Security (IPSec) Added by the Tweaking.com - Block IP Tool Even though this tool was built for watching the remote desktop port you can use it to watch any single port on the system. So if you have another kind of server running and the port open to the internet you can now log any IP that hits it. |
 |
9,136 | Dec 21, 2013 Tweaking.com |
|
| UpDown Meter v1.2.3 UpDown Meter v1.2.3 UpDown Meter graphs network activity for a specific network adapter. It is deliberately designed to consume trace memory and processor time, so it can run as long as the system runs, providing an overview of how the connection is being used. Usage When UpDown Meter is first run we see a prompt to choose a network adapter. To select an adapter, open the settings menu by clicking the button in the lower-right of the toolbox () or choose the settings option from the tray icon menu. Once an adapter has been selected and confirmed by clicking the [OK] or [Apply] buttons, the graph updates to show a scrolling image that updates once per second, as shown below. Each block divided by a dashed vertical line represents a unit of 30 seconds, so this graph is showing the last 61 seconds of network activity. Since the graph appears empty, either there is no activity or our graph is calibrated incorrectly. Once the graph has been calibrated it might look something like the following. The graph scrolls from right to left, so the newest information is displayed on the right. Red indicates downloaded data whilst green represents uploaded data. Yellow represents uploaded or downloaded data, depending on which is lesser at that point in time—it sounds weird but it's actually quite visually intuitive! Reading from the left, the graph above shows we started downloading data at full speed for about 80 seconds. Then, we stopped downloading and uploaded data at full speed for about 60 seconds (our upload capacity is approximately a quarter of our download capacity). Next, we started downloading at full speed whilst simultaneously continuing our upload for two minutes. During this period, we observe that our connection is unable to reach maximum download speed whilst also uploading at full speed. This is ... |
 |
5,285 | Feb 09, 2019 ScriptFUSION  |
|
| vmPing v1.3.11 vmPing v1.3.11 vmPing (Visual Multi Ping) is a graphical ping utility for monitoring multiple hosts. Numerous host monitors can be added and removed, and each monitor dynamically resizes with the application window. Color-coding allows you to tell at a glance the status of each host. In addition to standard ICMP pings, you can also perform a TCP 'port ping', where the application continuously connects to a specified port and displays whether or not the port is open. A fast trace route utility and a basic packet generator / stress tester is also included. Notes There is no installer. Just run the .exe. .NET 4.5 or greater is required. 1.3.11 3-1-21 The recent drag and drop feature was causing issues. Please update to this version if you downloaded 1.3.9-10. The drag and drop functionality is still there, but you must click and drag on the bar that appears across the top of each probe window. Features Quickly and easily ping multiple hosts. Color coding allows you to instantly determine the status of each host. Green means up. Red means down. Orange means error. Each host monitor dynamically resizes with the application's window. Take up your whole screen or reduce everything to a tiny window. Probe options to configure the interval between each ping request (anything from 1 second to several hours) and how many seconds until it is considered timed out. Monitor TCP ports. vmPing can continously connect to a given TCP port and will display whether the port is open or closed. Enter HOSTNAME:PORT for the hostname. For example, WebserverA:80 Option to log everything to a text file. Option to send email alerts. Each time ... |
 |
5,440 | Mar 03, 2021 Ryan Smith 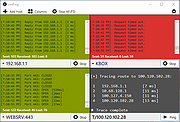 |
|
| Wfp Tool 1.3.7 Wfp Tool 1.3.7 Simple tool to configure Windows Filtering Platform (WFP) which can configure network activity on your computer. Features: Simple interface without annoying pop ups Dropped packets logging (Windows 7 and above) Internal blocking lists (malware, telemetry) Free and open source Localization support IPv4/IPv6 support Must right-click on executable and run as administrator. To activate portable mode, create "wfptool.ini" in application folder, or move it from "%APPDATA%\Henry++\Wfp Tool". License: GPL v3 Language: C/C++ Supported OS: Vista, 7, 8, 8.1, 10 Platform architecture: 32-bit/64-bit Support: www.henrypp.org/ |
 |
5,603 | Nov 29, 2016 Henry++  |
|
OlderGeeks.com Copyright (c) 2025