|

|
Processed through Paypal No account required. |








Buy our over-priced crap to help pay the bills.



|
|
Processed through Paypal No account required. |
| Files | ||||
| File Name | Rating | Downloads | ||
 |
Belarc Advisor v13.1 Belarc Advisor v13.1 👉 Creates a detailed profile of your PC’s hardware, software, and security status. Belarc Advisor builds a comprehensive report of your computer’s installed hardware, software, network inventory, missing Microsoft hotfixes, antivirus status, and security benchmarks. The report is generated locally and displayed in your web browser, ensuring that your data remains private and is not sent to any external server. Belarc Advisor is widely used for auditing systems, tracking installed software licenses, and identifying potential security risks. It provides a clear, organized breakdown of system components, including CPU, memory, storage devices, and connected peripherals, along with detailed software version information. Features: • Creates a complete system profile including hardware and software • Displays installed applications with version and license details • Identifies missing Microsoft security updates and hotfixes • Reports antivirus status and overall system security • Shows detailed network configuration and connected devices • Generates results locally for enhanced privacy (no data uploaded) • Provides browser-based report for easy viewing and printing • Tracks software licenses for auditing and recovery purposes • Displays detailed information about CPU, RAM, drives, and peripherals Supported operating systems: • Windows 7, Windows 8, Windows 10, Windows 11 Supported languages: English Changes: Not Provided Click here to visit the author's website. |
 |
11,494 | Apr 29, 2026 Belarc, Inc.  |
 |
Blender Benchmark v3.3.0 Blender Benchmark v3.3.0 👉 Benchmark your CPU and GPU performance using official Blender rendering workloads. Blender Benchmark is the official benchmarking utility from the Blender Foundation for measuring CPU and GPU rendering performance using real Blender scenes. It allows you to compare your system against hundreds of thousands of publicly submitted benchmark results through the Blender Open Data platform. The benchmark supports multiple Blender versions and render backends, making it useful for evaluating hardware upgrades, testing system stability, comparing driver performance, and validating overclocking results. Anonymous benchmark submissions help improve Blender development while giving users a reliable way to compare performance across a wide variety of hardware configurations. Features: • Official benchmark from the Blender Foundation. • Tests CPU and GPU rendering performance using real Blender scenes. • Supports multiple Blender versions for comparison testing. • Choose individual benchmark scenes or run the complete suite. • Supports CPU and GPU render devices where available. • Measures performance using Blender's Cycles rendering engine. • Upload benchmark results anonymously to Blender Open Data. • Compare results with hundreds of thousands of publicly submitted systems. • View detailed hardware rankings and performance statistics online. • Can be run offline using downloadable benchmark scripts and scenes. • Uses only free and open source software with public-domain benchmark content. Supported operating systems: • Windows 7, Windows 8, Windows 10, Windows 11 • macOS • Linux Supported languages: • English Changes: v3.3.0 03-10-26 Support for the latest Intel GPUs has been added using oneAPI. This download is for the Windows version (very bottom of page). All other download assets are below: Other Windows: benchmark-launcher-cli-3.3.0-windows.zip (Command Line Interface) macOS: benchmark-launcher-3.3.0-macos.dmg benchmark-launcher-cli-3.3.0-macos.zip (Command Line Interface) Linux: benchmark-launcher-3.3.0-linux.tar.gz benchmark-launcher-cli-3.3.0-linux.tar.gz (Command Line Interface) Click here to visit the author's website. |
|
3,368 | Jun 18, 2026 Blender Foundation  |
|
CoolTerm v2.4.0 CoolTerm v2.4.0 👉 Easy-to-use serial port terminal for communicating with connected hardware. CoolTerm is a simple serial port terminal application, with no terminal emulation, for hobbyists and professionals who need to exchange data with devices connected to serial ports, such as servo controllers, robotic kits, GPS receivers, microcontrollers, and other hardware. Written in Xojo. Features: • Multiple concurrent connections on separate serial ports • Display received data as plain text, hexadecimal, or graphic chart • Special receive and transmit character handling • Send data by keypress, Send String dialog, copy/paste, or file transfer • Send text and binary files by dialog or drag-and-drop • Capture received data to text or binary files • Local echo for transmitted and received data • Hardware and software flow control • Visual line status indicators • Manual control of RTS, DTR, and serial BREAK • Configurable character, line, and packet delays • Transmit macros, saved connection options, and scripting support Installation CoolTerm comes without an installer and can be placed anywhere on the hard-drive as long as the correct folder structure is maintained. I.e. the included "Libs" and "Resources" folders must reside in the same location as the CoolTerm application. Supported operating systems: Windows 8.1, 10, 11 macOS Mojave 10.14.x and higher Changes v2.4.0 05-19-25 NEW FEATURES: - Added the same "wait for termination string" options to the timestamp settings for received data as for captured data. This makes it possible to specify the termination string to wait for before timestamping and displaying received data. - Added option to include the timestamps added to received data in the data forwarded to other terminals. - Added support for relative and local paths in .CoolTermSession files. Paths beginning with .. and . will be considered relative and local paths, respectively. Saving a session will write absolute paths for all open terminals to the session file. However, a session file can be edited with a text editor and paths can be ... |
|
3,977 | May 07, 2026 Roger Meier  |
|
Core Temp v1.21 Core Temp v1.21 👉 Compact CPU monitoring utility for tracking processor temperatures, loads and other vital information. Core Temp is a small, lightweight processor monitoring utility designed to display the temperature of each individual CPU core in real time. It reads the Digital Thermal Sensors built into modern Intel, AMD and VIA x86 processors, providing accurate temperature information directly from the processor rather than relying on motherboard sensors. It can also display processor model information, frequencies, load levels, power-related data and minimum, maximum and average temperature readings. Core Temp offers customizable notification-area monitoring, logging, Mini-Mode and support for plug-ins that can extend its functionality. Features: • Monitors the temperature of individual CPU cores in real time • Reads temperatures directly from the processor's Digital Thermal Sensors • Supports Intel, AMD and VIA x86 processors • Displays processor identification and model information • Shows individual core load information • Displays processor frequency information • Tracks minimum, maximum and average temperature readings • Provides configurable notification-area sensor displays • Includes a battery status indicator for the notification area • Includes a compact Mini-Mode display • Adjustable user-interface zoom • Can log processor temperature and monitoring information • Supports multiple processors and multiple cores • Motherboard-independent temperature monitoring • Provides shared-memory data for other applications • Supports plug-ins and add-ons for expanded functionality • Lightweight design with a small system footprint Supported operating systems: • Windows XP, Windows 7, Windows 8, Windows 8.1, Windows 10, Windows 11 • Windows Server 2003, Windows Server 2008, Windows Server 2012, Windows Server 2016, Windows Server 2019, Windows Server 2022, Windows Server 2025 Supported languages: English, Abkhaz, Armenian, Bulgarian, Simplified Chinese, Traditional Chinese, Catalan, Czech, Danish, Dutch, Finnish, French, Galician, German, Greek, Hebrew, Hungarian, Italian, Japanese, Korean, Norwegian, Polish, Portuguese, Romanian, Russian, Slovak, Slovenian, Spanish, Swedish, Turkish, Ukrainian, Vietnamese Changes: v1.21 10-03-26 - New: Redesign the notification tray configuration dialog. Should now be more intuitive and flexible. - Fix: Notification tray icons issues; missing ... |
|
5,442 | Oct 14, 2026 Arthur Liberman 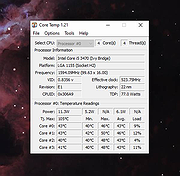 |
|
CPU-Z v3.0.1 CPU-Z v3.0.1 👉 Free system profiling tool that provides detailed information about your CPU, motherboard, memory, and more. CPU-Z is a lightweight diagnostic utility designed to provide in-depth information about your computer’s hardware. It identifies the processor name and number, codename, process, package, cache levels, and real-time core frequency. It also reports detailed information about the motherboard including chipset, BIOS version, and graphic interface details. CPU-Z displays memory information such as type, size, timings, and specifications (SPD), making it especially useful for verifying RAM configurations. The software also includes a built-in benchmark and stress test to evaluate processor performance and compare results with other systems. Features: • Processor name, codename, architecture, process, package, and cache details • Real-time core frequency and multiplier monitoring • Mainboard manufacturer, model, chipset, and BIOS information • Memory type, size, timings, and SPD data for each module • Graphics interface information • Built-in CPU benchmark and stress test • Validation feature to share system configuration Supported operating systems: • Windows 7, Windows 8, Windows 10, Windows 11 Supported languages: English, French, Spanish, German, Italian, Portuguese, Chinese (Simplified), Chinese (Traditional), Japanese, Korean, Russian Changes: v3.0.1 08-20-26 CPU-Z Validator V3 (more information *at that address*). 👉 This download is for the Windows version (very bottom of page). All other download assets are below: Other Windows: cpuz-arm64_1.05.zip (ARM64) cpu-z_1.04-win9x.zip (Vintage Edition for Windows 95/98) Click here to visit the author's website. |
|
9,391 | Oct 01, 2026 CPUID 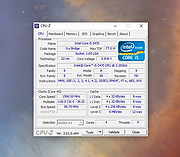 |
|
DevManView v1.81 DevManView v1.81 👉 Advanced alternative to the Windows Device Manager with enhanced device management tools. DevManView is a lightweight, portable utility that serves as an alternative to the standard Windows Device Manager. Instead of displaying hardware in a tree structure, it presents every installed device in a flat, sortable table with detailed information such as device name, manufacturer, service, driver version, install time, connection status, and more. It also allows you to enable, disable, uninstall, restart, and inspect devices with just a few clicks. DevManView can connect to remote computers (with administrative rights), load device information from an offline Windows installation, export device lists, and includes command-line options for automation and scripting. Features: • Displays all installed devices in a sortable table instead of a tree view • Shows detailed hardware and driver information • Enable, disable, uninstall, or restart devices • View devices on remote computers with administrator access • Load device information from an offline Windows installation • Export device lists to HTML, CSV, XML, or text • Open related Registry keys and INF files • Create desktop shortcuts to enable or disable devices • Powerful command-line support for scripting and automation • Portable application with no installation required Supported operating systems: • Windows XP, Windows Server 2003, Windows Vista, Windows 7, Windows 8, Windows 8.1, Windows 10, Windows 11 Supported languages: • Arabic, Basque, Bulgarian, Catalan, Chinese (Simplified), Chinese (Traditional), Croatian, Czech, Danish, Dutch, English, Finnish, French, German, Greek, Hebrew, Hungarian, Italian, Japanese, Korean, Polish, Portuguese (Brazil), Romanian, Russian, Slovak, Slovenian, Spanish, Swedish, Thai, Turkish, Ukrainian, Vietnamese Changes: v1.81 06-22-26 • Added 'Open Device In Registry Editor' option. • Added 'Open Device In RegEdit' to the right-click context menu. This download is for the Windows 64bit version (very bottom of page). If you need the Windows 32bit version, download here. Click here to visit the author's website. |
|
7,314 | Jun 23, 2026 Nir Sofer 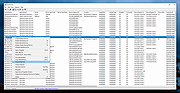 |
|
Fan Control v275 Fan Control v275 👉 Highly customizable fan control software for Windows. Fan Control is a focused and highly customizable fan controlling software for Windows that lets you control CPU, GPU, and case fans using temperature-based logic. It supports guided setup, multiple profiles, theme customization, multiple temperature sources, several fan curve functions including custom graphs, mixed fan curves and sensors using max, min, or average logic, low resource usage, and advanced tuning options such as steps, start and stop percentages, response time, and hysteresis. Features: • Guided setup process on first launch • Save, edit, and load multiple profiles • Change the theme and color of the application • Multiple temperature sources including CPU, GPU, motherboard, and hard drives • Multiple fan curve functions, including a custom graph • Mix fan curves or sensors together using max, min, or average • Low resource usage • Advanced tuning with steps, start %, stop %, response time, and hysteresis • Extensive support for CPU, GPU, case fans, and other hardware such as AIOs • Plugin support for adding third-party temperature, speed, or control sensors Fan curve types • Auto: PI-ish type function. % will surf until temp is stable at load. • Linear : Temperature based linear function • Graph : Temperature based custom curve • Target: Temperature based that holds speed until target temperature is reached • Mix : Use two different curves and apply a mix function (Min, Max, Sum, Average) • Sync : Sync to an existing control • Flat: Set a fixed % Graph fan curve editor • Change the temperature range for finer control ... |
|
7,181 | Aug 26, 2026 Rem0o 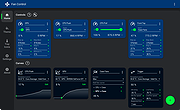 |
|
Feex v0.19.12 Feex v0.19.12 👉 A free Windows utility for monitoring, diagnosing, understanding and maintaining your PC. Feex is a free Windows system utility that combines PC monitoring, diagnostics and maintenance tools in a single application. It provides real-time information about CPU, GPU, memory, disks and other system activity while helping identify applications and processes that may be consuming excessive resources. Feex goes beyond basic system monitoring by keeping useful historical information about your computer. It can analyze startup programs, monitor boot speed over time and help identify common Windows problems and changes that may be affecting performance. Detailed hardware and system information is available to help you understand the components and configuration of your PC. Built-in maintenance tools can help clean caches and unnecessary files, locate duplicate files and perform Windows maintenance and performance tasks. When Feex proposes meaningful changes to the system, it explains what will be affected and asks for approval before proceeding. Privacy is an important part of Feex's design. System understanding and history are stored locally on the PC, and the program can continue operating without an Internet connection. File discovery uses metadata such as filenames, types, sizes and dates rather than reading the contents of documents, emails or chats. Feex does not collect passwords or browsing history, capture the screen, log keystrokes, record audio or video, or inspect the contents of network traffic. It is not intended to replace antivirus software and can be used alongside Windows Defender or other security software. Features: • Monitors CPU, GPU, RAM, disk and overall system activity • Identifies resource-heavy applications and processes • Analyzes programs configured to run at startup • Monitors boot speed and maintains boot history • Provides detailed hardware and system information • Detects common Windows issues • Cleans caches and unnecessary files • Detects duplicate files • Provides Windows maintenance and performance tools • Keeps historical information about system behavior • ... |
|
392 | Sep 04, 2026 Feex 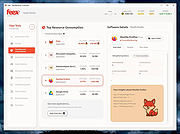 |
|
Flyoobe v3.03.100 Flyoobe v3.03.100 👉 A Windows setup and upgrade toolkit for reviewing, customizing and applying Windows 11 settings from one streamlined interface. Flyoobe is a Windows setup assistant that brings Windows settings, applications, personalization, bloatware management and upgrade tools together in one place. It uses a signature-driven checklist approach to show what is currently configured, what differs from its recommendations and what can be changed. Users can apply individual settings, restore defaults, create portable setup recipes, install apps through winget, review removable preinstalled apps and access common Windows workflows without replacing Windows Settings. The built-in Flyby11 upgrade path also helps Windows 10 systems that do not meet every Windows 11 requirement move to Windows 11. Features: • Unified overview for Windows settings, apps, personalization, bloatware and system tasks • Signature-driven Windows configuration using the editable Flyoobe.ini file • Portable setup recipes that can be saved, imported, reviewed and applied on another PC • Recipe review mode lets you inspect and discard staged changes before applying them • Individual Apply and Restore default controls for supported Windows settings • Searchable winget application installer using an editable Apps.ini catalog • Detects matching preinstalled Windows apps using Bloatware.ini and offers optional removal • Detects installed web browsers and provides quick access to Windows default-app settings • Personalization controls for Windows mode, app mode, taskbar alignment, transparency and wallpaper • Quick access to account, device, network and Windows Update workflows • Integrated Flyby11 upgrade path for Windows 10 PCs that do not meet every Windows 11 requirement • Read-only compatibility checks for TPM, Secure Boot, memory, architecture, storage and Windows version • Optional AI explanations for individual settings without allowing AI to apply changes • Native WinForms interface with improved high-DPI scaling • Editable configuration files keep recommendations, app catalogs, bloatware signatures and upgrade limits separate from the executable Supported operating systems: • Windows 10, Windows 11 Supported languages: • English, German Changes: v3.03.100 09-28-26 [Added] ... |
|
3,855 | Sep 30, 2026 Builtbybel 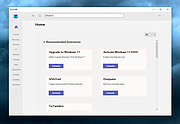 |
|
FurMark 2 v2.10.2 FurMark 2 v2.10.2 OpenGL and Vulkan GPU stress test and graphics benchmark. FurMark 2 is the next-generation edition of the legendary GPU stress testing and benchmarking utility from Geeks3D. Designed for gamers, overclockers, system builders and hardware enthusiasts, FurMark 2 pushes graphics cards to their thermal and performance limits using demanding OpenGL and Vulkan rendering workloads. It is commonly used to test cooling performance, verify GPU stability, identify overheating issues, detect graphical artifacts, and benchmark overall graphics performance. Unlike the original FurMark 1, FurMark 2 introduces a redesigned engine with modern rendering technologies, Vulkan support, improved compatibility with current GPUs, and enhanced benchmarking capabilities. The software can run intensive fullscreen or windowed stress tests while displaying real-time GPU information including temperatures, clocks, usage, fan speeds, and performance statistics. FurMark 2 also includes benchmark presets for quick comparisons, customizable testing modes, anti-aliasing options, artifact scanning, and command-line support for automation and advanced diagnostics. Whether you are validating a fresh GPU installation, testing overclock stability, troubleshooting crashes, or simply comparing benchmark scores with other systems online, FurMark 2 provides a fast and reliable solution for GPU performance analysis. Features: • Advanced OpenGL and Vulkan GPU stress testing • Designed to heavily load GPUs for thermal and stability testing • Modern rendering engine optimized for current graphics hardware • Built-in benchmark presets for quick performance comparisons • Custom benchmark modes with adjustable resolution and anti-aliasing • Real-time GPU monitoring during testing sessions • Displays GPU temperature, clocks, fan speed, usage and performance data • Artifact scanner helps detect rendering errors and unstable overclocks • Supports fullscreen and windowed testing modes • Online benchmark score submission and comparison support • Useful for validating overclocking and cooling system performance • Command-line options for scripting and automated testing • Compatible with many NVIDIA, AMD and Intel graphics cards • Includes GPU information and hardware identification tools • Lightweight interface with quick access to common ... |
|
2,154 | Jun 05, 2026 Geeks3D 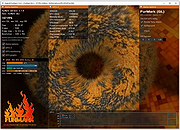 |
|
HWiNFO v8.54 HWiNFO v8.54 👉 Professional hardware information, real-time monitoring, and diagnostics for Windows and DOS systems. HWiNFO is a comprehensive hardware analysis, system information, diagnostics, and real-time monitoring utility designed for enthusiasts, technicians, and IT professionals. It provides detailed information about virtually every hardware component in your computer while continuously monitoring temperatures, voltages, fan speeds, power usage, clocks, storage health, and many other sensor values. HWiNFO also generates comprehensive hardware reports, supports extensive logging, and integrates with numerous third-party monitoring applications through its shared memory interface. Features: • In-depth hardware information with detailed analysis of system components • Real-time monitoring of CPUs, GPUs, mainboards, drives, and peripherals • System health monitoring designed to help detect overheating, overload, performance loss, or possible failure • Extensive reporting with full hardware hierarchy or quick summary overview • Export reports in XML, CSV, and HTML formats • Customizable monitoring tables, graphs, tray icons, and OSD • Customizable alerts on monitored parameters with user-defined actions • Support for interfacing with other applications and third-party extensions • Shared Memory interface support for exposing sensor data • Clean and secure design with no personal data collection and no network transmission • Frequently updated to support new hardware, technologies, and standards Supported operating systems: • Windows 95 and later (x86, x64 or ARM64) Supported languages: English, French, German, Spanish, Portuguese (Brazil), Italian, Dutch, Danish, Chinese (Simplified), Chinese (Traditional), Japanese, Korean, Vietnamese, Arabic, Russian, Ukrainian, Czech, Slovak, Hungarian, Polish, Swedish, Finnish, Norwegian, Greek, Turkish, Latvian, Hebrew Changes: v8.54 09-30-26 Added reporting of monitored process name to RTSS sensor title. Added workaround for NVML crash during GPU driver update. Fixed NZXT Kraken Elite V2 support. Fixed reporting of negative temperatures for NVIDIA GPU memory chips. Added ability to show multiple values on one line in OSD. Fixed reporting of PCH power on Intel Panther Lake and later. Added reporting of Fan Duty for Thermal Grizzly WireView Pro II. Added options to insert notes into json sensor log. Improved ... |
|
13,445 | Oct 02, 2026 REALiX 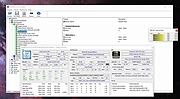 |
|
HWMonitor v1.68 HWMonitor v1.68 👉 Hardware monitoring tool that displays real-time system sensor data. HWMonitor is a hardware monitoring program that reads PC system health sensors to display voltages, temperatures, fan speeds, and power consumption in real time. It provides a clear and organized view of key hardware metrics gathered from onboard sensors, helping users monitor system stability and performance. HWMonitor supports a wide range of hardware including CPUs, GPUs, motherboards, and storage devices. It can read data from SMART-enabled hard drives, temperature sensors, and voltage rails, making it useful for diagnosing overheating issues or checking system performance under load. The interface is simple and lightweight, showing minimum, maximum, and current values for each sensor, allowing users to track changes over time without unnecessary clutter. Features: • Monitors temperatures, voltages, fan speeds, and power usage • Displays minimum, maximum, and current sensor values • Supports CPUs, GPUs, hard drives, and motherboards • Reads SMART data from storage devices • Lightweight and portable-friendly operation • Simple, easy-to-read interface Supported operating systems: • Windows XP, Windows Vista, Windows 7, Windows 8, Windows 10, Windows 11 Supported languages: English Changes: v1.68 09-14-26 PCI Express errors counters on AMD and Intel GPUs. New metrics on AMD Strix Point, Strix Halo and Kraken Point : NPU power, NPU clocks, NPU TOPS and TOPS per watt, NPU DRAM bandwidth usage, global platform power and DRAM read and write bandwidths. New HDD metrics (IOPS, average latency, NVMe controller link speed). Remembers devices & sensor types nodes state. This download is for the Windows x86/x64 version (very bottom of page). All other download assets are below: Other Windows: hwmonitor-arm64_1.05.zip Click here to visit the author's website. |
|
7,738 | Sep 16, 2026 CPUID 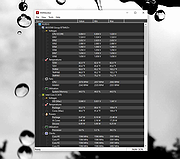 |
 |
IsMyMemoryOK v1.33 IsMyMemoryOK v1.33 👉 Quick and reliable RAM testing tool for Windows systems. IsMyMemoryOK is a lightweight memory diagnostics utility designed to test the stability and performance of DDR3, DDR4, DDR5, and DDR6 RAM modules on Windows PCs. The program allows users to quickly check for memory errors, instability, or hardware issues that can cause crashes, freezes, and blue screens. Its portable design means no installation is required, making it useful for technicians, troubleshooting, and system diagnostics on both older and modern Windows systems. Features: • Fast RAM stability and stress testing • Supports DDR3, DDR4, DDR5, and DDR6 memory • Portable application with no installation required • Adjustable test duration and memory load • Quick benchmark and diagnostic functions • Helps identify defective or unstable RAM • Simple and lightweight user interface • Optional screenshot functionality • Low CPU overhead during testing • Suitable for technicians and troubleshooting tasks Supported operating systems: • Windows XP, Windows Vista, Windows 7, Windows 8, Windows 8.1, Windows 10, Windows 11, Windows Server 2016, Windows Server 2019 Supported languages: English, German, French, Spanish, Italian, Portuguese, Dutch, Polish, Czech, Slovak, Hungarian, Romanian, Bulgarian, Greek, Russian, Ukrainian, Turkish, Chinese, Japanese, Korean, Arabic Changes: v1.33 05-11-26 Minor adjustments to the IsMyMemoryOK memory test application for all Windows operating systems. Bug fix in the screenshot function. Improved system language translation. This download is for the Windows 64bit version (very bottom of page). If you need the Windows 32bit version, download here. Click here to visit the author's website. |
|
1,330 | May 15, 2026 Nenad Hrg 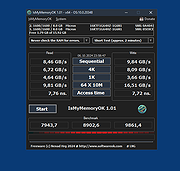 |
|
JSimStudio v1.1.3 JSimStudio v1.1.3 👉 Control and simulation utility for the Jupiter Instruments JI-820 USB incremental encoder emulator. JSimStudio is a portable simulation and control utility designed for the Jupiter Instruments JI-820 USB incremental encoder emulator. It allows engineers and developers to simulate encoder signals in real-world units, configure encoder scaling, and generate quadrature outputs for testing encoder-input hardware, PLCs, motion controllers, and software before connecting physical equipment. A built-in motion profile engine makes it easy to create repeatable test sequences using step, ramp, S-curve, and loop segments. JSimStudio also includes an integrated GPS/NMEA simulator that converts simulated encoder movement into standard NMEA-0183 data streams over serial, TCP, or UDP, making it useful for testing navigation and positioning applications. Version 1.1.1 adds a complete rotational simulation mode with RPM, degrees, and radians support, pulses-per-revolution scaling, independently selectable velocity and acceleration units, and the ability to bind GPS/NMEA network output to a specific network adapter. A built-in mock mode allows the software to run without JI-820 hardware attached for evaluation and development. When using an actual JI-820 device, the standard FTDI USB driver is required. Features: • Controls the Jupiter Instruments JI-820 USB incremental encoder emulator • Simulates quadrature encoder signals using real-world engineering units • Configurable encoder scaling and pulses-per-revolution settings • Motion profile editor with step, ramp, S-curve, and loop segments • Rotational simulation using RPM, degrees, or radians • Independently configurable velocity and acceleration units • Built-in GPS/NMEA-0183 simulator • Outputs NMEA data over serial, TCP, or UDP • Option to bind GPS/NMEA network output to a single network adapter • Mock mode allows operation without connected hardware • Portable application requiring no installation Supported operating systems: • Windows 10 (64-bit), Windows 11 (64-bit) Supported languages: English Changes: v1.1.3 07-20-26 Improved support for smaller displays and resized application windows. Fixed the velocity-profile loop function not working correctly. Note: This file has one hit on VirusTotal. We have confirmed this to be a false positive. ... |
|
332 | Jul 21, 2026 Funciona Systems 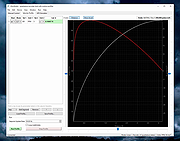 |
|
Libre Hardware Monitor v0.9.6 Libre Hardware Monitor v0.9.6 👉 Free and open source hardware monitoring software for temperatures, fan speeds, voltages, loads, and clock speeds. Libre Hardware Monitor is free software that can monitor the temperature sensors, fan speeds, voltages, load and clock speeds of your computer. The project includes a Windows Forms application and a library for developers, and it can read information from devices such as motherboards, Intel and AMD processors, NVIDIA, AMD and Intel graphics cards, HDD, SSD and NVMe drives, and network cards. Features: • Monitors temperature sensors, fan speeds, voltages, loads, and clock speeds across supported hardware. • Reads detailed data from motherboard sensors including chipsets and embedded controllers. • Supports monitoring for Intel and AMD CPUs including per-core metrics. • Supports NVIDIA, AMD, and Intel GPUs with temperature, clock, and voltage reporting. • Monitors storage devices including HDD, SSD, and NVMe drives with SMART data support. • Displays real-time system load and performance metrics. • Provides a clean Windows Forms interface for easy viewing of all sensor data. • Includes a developer-friendly library for integrating hardware monitoring into other applications. • Supports additional devices such as network cards where sensor data is available. • Offers a remote monitoring interface via built-in web server (/metrics endpoint). • Allows exporting sensor data for external monitoring tools. • Expands support for modern chipsets, motherboards, and controllers. • Detects and displays multiple sensors per device where available. • Provides continuous real-time updates of hardware status. Supported operating systems: • Windows 11, Windows 10 22H2 or later for the .NET 10 build. • Windows 7 SP1, Windows 8.1, Windows 10 version 1607 or later for the .NET Framework 4.7.2 build. Supported languages: English, German, Spanish, French, Italian, Japanese, Polish, Russian, Swedish, Turkish, Chinese (Simplified), Chinese (Traditional) Changes: v0.9.6 02-14-26 Update DiskInfoToolkit. GA-A320M add missing controls. Feature/arctic fan controller. Bump System.IO.Ports from 10.0.1 to 10.0.2. Bump System.Management from 10.0.1 to 10.0.2. Bump System.Threading.AccessControl from 10.0.1 to 10.0.2. Bump System.Text.Json from 10.0.1 to 10.0.2. Bump ... |
|
4,037 | Apr 22, 2026 LibreHardwareMonitor 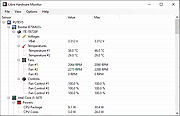 |
|
MACAddressView v1.55 MACAddressView v1.55 👉 Find the manufacturer and details behind any MAC address. MACAddressView is a lightweight MAC address lookup utility that lets you quickly identify the company name, address, and country associated with a network device's MAC address. Instead of querying an online service, it uses a built-in IEEE OUI database stored inside the executable, allowing lookups to be performed entirely offline. The program can search by MAC address, company name, company address, or country, making it useful for network administrators, technicians, security professionals, and anyone troubleshooting or documenting network hardware. Results can be copied to the clipboard or exported to TXT, CSV, HTML, XML, and other formats for reporting or further analysis. MACAddressView is fully portable, requires no installation, and supports command-line operation for automation and scripting. Features: • Offline MAC address lookup using an internal IEEE OUI database • Find vendor information by MAC address, company name, address, or country • Display company name, address, country, and assigned MAC address range • Search multiple MAC addresses simultaneously • Lookup complete MAC addresses or vendor prefixes (OUI) • View the MAC addresses assigned to the current computer • Export results to TXT, CSV, HTML, XML, and tab-delimited formats • Copy results directly to the clipboard • Command-line support for automated lookups and exports • Portable with no installation required • Supports custom language translation files Supported operating systems: • Windows 98, Windows ME, Windows 2000, Windows XP, Windows Server 2003, Windows Vista, Windows 7, Windows 8, Windows 8.1, Windows 10, Windows 11 Supported languages: • Arabic, Bulgarian, Chinese (Simplified), Chinese (Traditional), Czech, Dutch, English, French, German, Greek, Hungarian, Italian, Japanese, Korean, Polish, Portuguese (Brazil), Romanian, Russian, Slovak, Spanish, Turkish, Ukrainian Changes: v1.55 07-01-26 Updated the internal MAC Addresses database. Note: This file has two hits on VirusTotal. We have confirmed these to be false positives. The file is safe. Click here to visit the author's website. |
|
10,166 | Jul 10, 2026 Nir Sofer 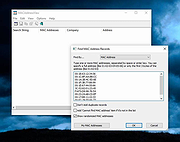 |
|
Novabench v6.0.3 Novabench v6.0.3 👉 Free PC benchmarking and hardware performance testing utility. Novabench is a free benchmarking program that allows you to quickly test and evaluate your computer’s overall performance. It measures CPU, GPU, RAM, and storage speeds using a simple interface designed for both casual users and technicians. The free version provides a complete system benchmark score along with detailed hardware information and comparison tools to help identify performance bottlenecks or hardware problems. Novabench can be useful for checking system stability after upgrades, comparing hardware performance against similar systems, troubleshooting slow computers, and monitoring the effects of overclocking or driver updates. Benchmark results can also be uploaded online to compare your PC with other systems using the Novabench database. Features: • Free CPU, GPU, RAM, and disk benchmarking • Generates an overall system performance score • Quick benchmark testing with minimal setup required • Displays detailed hardware and system information • Compare benchmark results with other systems online • Useful for testing gaming PCs, laptops, and workstations • Helps identify hardware bottlenecks and slow components • Portable benchmark results that can be shared online • Lightweight interface suitable for beginners and technicians • Supports stress testing and stability verification tools • Includes temperature and hardware monitoring support • Can help verify system improvements after upgrades or repairs Supported operating systems: • Windows 10, Windows 11 • macOS 11 Big Sur or higher • Linux distributions supporting modern x86-64 hardware Supported languages: • English Changes: v6.0.3 06-09-26 • Improved benchmark reliability and scoring consistency • Updated hardware detection and compatibility support • General bug fixes and stability improvements This download is for the Windows installer version (very bottom of page). All other download assets are below: Other Windows: novabench-arm64.exe macOS: novabench.dmg Linux: novabench-x64.deb novabench-arm64.deb novabench-x64.rpm novabench-arm64.rpm Click here to visit the author's website. |
|
7,802 | Jun 09, 2026 Novawave Inc. 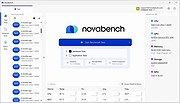 |
|
O&O DeskInfo v2.0.1033 O&O DeskInfo v2.0.1033 👉 Portable desktop system monitor that displays real-time hardware and network information directly on your desktop. O&O DeskInfo displays essential system information such as CPU usage, memory consumption, drive activity, network connections, battery status, and more directly on the Windows desktop in real time. The portable freeware utility allows users to monitor system activity without opening additional tools or menus. It also supports customizable layouts, colors, transparency, fonts, and multi-monitor positioning. O&O DeskInfo can quickly copy system details to the clipboard for troubleshooting and support purposes and includes warnings for unknown USB device connections. Features: • Real-time display of CPU, memory, drive, and network activity • Portable application with no installation required • Customizable desktop display position, colors, fonts, and transparency • Performance charts for CPU, memory, and network monitoring • Battery status display support for compatible systems • Detection of virtual machines • Profile editor with customizable columns and sortable categories • Clear distinction between local, removable, and network drives • Clipboard export for quick support and troubleshooting • Multi-monitor support • Warning notifications for unknown USB device connections • Adjustable update speeds and display modes • Tray icon integration with quick access functions • Automatic startup option with Windows Supported operating systems: • Windows 10 • Windows 11 Supported languages: • English, German, French Changes: v2.0.1033 01-28-26 • NEW: New performance charts for CPU, memory and network • NEW: Battery status display, if supported by the system • NEW: Detection of virtual machines • NEW: Greater flexibility in the profile editor with freely selectable columns and re-sortable categories • NEW: Improved customization options for the size of performance charts • NEW: Unified controls for a more consistent and clearer user interface • NEW: Extended documentation • NEW: Clearer distinction between local, removable and network drives • CHANGED: Performance charts react faster and more smoothly to display setting changes • CHANGED: Charts make better use of available space and appear overall clearer • CHANGED: Reduced visual duplication for a calmer display • ... |
|
3,673 | May 24, 2026 O&O Software GmbH 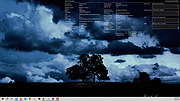 |
|
Open Hardware Monitor v0.9.6 Open Hardware Monitor v0.9.6 The Open Hardware Monitor is a free open source software that monitors temperature sensors, fan speeds, voltages, load and clock speeds of a computer. The Open Hardware Monitor supports most hardware monitoring chips found on todays mainboards. The CPU temperature can be monitored by reading the core temperature sensors of Intel and AMD processors. The sensors of ATI and Nvidia video cards as well as SMART hard drive temperature can be displayed. The monitored values can be displayed in the main window, in a customizable desktop gadget, or in the system tray. The free Open Hardware Monitor software runs on 32-bit and 64-bit Microsoft Windows XP / Vista / 7 / 8 / 8.1 / 10. Supported Hardware CPU core sensors Intel Core 2, Core i3/i5/i7, Atom, Sandy Bridge, Ivy Bridge, Haswell, Broadwell, Silvermont, Skylake, Kaby Lake, Airmont, Goldmont, Goldmont Plus, Cannon Lake, Ice Lake, Tremont, Tiger Lake AMD K8 (0Fh family), K10 (10h, 11h family), Llano (12h family), Fusion (14h family), Bulldozer (15h family), Jaguar (16h family), Puma (16h family), Ryzen (17h family) Mainboard sensors ITE IT8620E, IT8628E, IT8655E, IT8665E, IT8686E, IT8688E, IT8705F, IT8712F, IT8716F, IT8718F, IT8720F, IT8721F, IT8726F, IT8728F, IT8771E, IT8772E, IT8792E/IT8795E Fintek F71808E, F71858, F71862, F71868AD, F71869, F71869A, F71882, F71889ED, F71889AD, F71889F Nuvoton NCT6102D, NCT6106D, NCT6771F, NCT6772F, NCT6775F, NCT6776F, NCT6779D, NCT6791D, NCT6792D, NCT6792D-A, NCT6793D, NCT6795D, NCT6796D, NCT6796D-R, NCT6797D, NCT6798D Winbond W83627DHG, W83627DHG-P, W83627EHF, W83627HF, W83627THF, W83667HG, W83667HG-B, W83687THF GPU sensors Nvidia ... |
|
5,037 | Dec 28, 2020 Michael Mφller 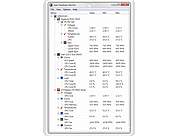 |
|
OpenCloseDriveEject v3.55 OpenCloseDriveEject v3.55 👉 Quickly open, close, and safely eject drives and removable media in Windows. OpenCloseDriveEject is a small Windows tool that lets you open and close DVD, CD, and Blu-ray drives, and safely eject removable storage like USB, SD, and SSD devices. It can run as a portable app, includes optional To-Tray/hidden startup behavior, and also offers command-line options for simple automation. Features: • Open and close optical drive trays (CD, DVD, Blu-ray) • Safely eject removable media (USB, SD, SSD, external drives) • Portable application, no installation required • Command-line support (start hidden, start to tray, custom INI path) • Optional start minimized or in system tray • Multilingual interface Supported operating systems: • Windows XP, Windows Vista, Windows 7, Windows 8.1, Windows 10, Windows 11 • Windows Server 2012, Windows Server 2016, Windows Server 2019, Windows Server 2022, Windows Server 2025 Supported languages: German, English, French, Greek, Traditional Chinese, Bulgarian, Korean, Russian, Japanese, Polish, Turkish, Italian, Dutch, Swedish, Norwegian, Portuguese, Danish, Irish, Thai, Spanish (Venezuela), Persian, Arabic, Hebrew, Finnish, Czech, Simplified Chinese, Bosnian, Croatian, Serbian, Catalan Changes: v3.55 05-02-26 • Important tests of the OpenCloseDriveEject app for the next MS Windows 11 build • Update of the OpenCloseDriveEject.exe language files A simple example of using the "Open Close Eject the Drive Tool" This download is for the Windows 64bit portable version. If you need the Windows 32bit portable version, download here. Click here to visit the author's website. |
|
5,534 | Jul 11, 2026 Nenad Hrg 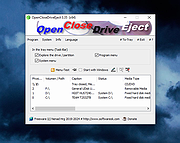 |
|
QuickMemoryTestOK v5.55 QuickMemoryTestOK v5.55 👉 Quickly test your Windows PC's RAM for errors. QuickMemoryTestOK is a small Windows utility that helps check your computer's RAM for bad or corrupted memory areas, and can also be used to test system behavior under high memory usage. Features: • Quick memory test for RAM errors • Helps detect bad or corrupted memory areas • Test Windows behavior under high memory usage • Customizable test runs • Pause and resume testing • Clear memory status display • Shows CPU load during testing • Access to useful memory and system tools • Zoom option for easier viewing • Very small program with low CPU usage • Portable version available Supported operating systems: • Windows 11, Windows 10, Windows 8.1, Windows 7, Windows Server 2012-2025, Windows Server 2022, x64, x32, x86 Supported languages: German, English, Korean, French, Bulgarian, Japanese, Traditional Chinese, Slovenian, Polish, Afrikaans, Simplified Chinese, Russian, Portuguese, Hungarian, Italian, Thai, Spanish, Hebrew, Hindi, Vietnamese, Malay, Indonesian, Filipino, Dutch, Norwegian, Danish, Finnish, Greek, Spanish-VE, Czech, Arabic, Bosnian, Turkish, Ukrainian Changes: v5.55 06-07-26 • Update of language files in the Memory Test Tool for all MS Windows operating systems • Improvements to RAM detection 👉 This download is for the Windows 64bit portable version (very bottom of page). All other download assets are below: Other Windows: QuickMemoryTestOK.zip (32bit portable) Click here to visit the author's website. |
|
6,378 | Sep 18, 2026 Nenad Hrg 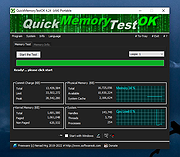 |
|
SIV (System Information Viewer) v5.88 SIV (System Information Viewer) v5.88 👉 Detailed Windows system, hardware, sensor, and network information utility. SIV (System Information Viewer) is a general Windows utility for displaying extensive system information, including CPU, PCI, PCMCIA, USB, SMBus, SPD, ACPI, machine, hardware sensor, network, and operating system details. It can also control certain AIO devices such as fans and LEDs by using the appropriate command-line option Features: • Displays detailed CPU information including processor type, features, clock speeds, and topology. • Reports motherboard, chipset, BIOS information, and firmware details. • Shows comprehensive PCI, PCIe, EISA, and PCMCIA device information. • Provides SMBus and SPD data including memory module information and sensor readings. • Displays detailed hardware sensor information including temperatures, voltages, and fan speeds. • Reports GPU information including PCIe link speed and lane configuration. • Shows USB device information and connected hardware details. • Displays ACPI information and power management related system data. • Provides detailed operating system information including installed updates and system configuration. • Shows network adapter information, IP configuration, and network statistics. • Supports viewing hardware I/O ports and device resource allocations. • Includes tools to view ghost devices and hidden hardware entries in the system. • Can generate and save detailed system reports for diagnostics or troubleshooting. • Allows optional control of supported AIO devices such as fans and LEDs via command-line options. • Designed to work across both modern and legacy Windows systems, including classic Windows 9x platforms. Supported operating systems: • Windows 11, Windows 10, Windows 8.1, Windows 8, Windows 7, Windows Vista, Windows XP, Windows Server 2022, Windows Server 2019, Windows Server 2016, Windows Server 2012, Windows Server 2008, Windows Server 2003, Windows 2000, Windows NT 4.0, Windows NT 3.51, Windows 95, Windows 98, Windows Me Supported languages: • English, Chinese (Simplified), Chinese (Traditional), Russian, Greek Changes: v5.88 10-14-26 Added GUID Class Names to [Lookup] (Menu->Help->SIV Lookup) and enable [WEB UPD] when later files are available. Added ASRock A520M-HVS ... |
|
20,308 | Oct 15, 2026 Ray Hinchliffe 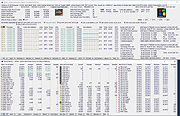 |
|
StressMyPC v5.88 StressMyPC v5.88 👉 Stress test your PC’s CPU, GPU and hard drive. StressMyPC is stress testing software used to put a Windows PC under heavy load for stability testing, battery drain testing or general hardware stress testing. It can stress the processor, graphics card and hard drive, and it is especially useful for seeing how a system behaves under full load. Features: • Start and stop PC stress testing quickly • Paint-Stress for simple GPU stress testing • Aggressive CPU-Stress for processor load testing • HD-Stress for hard drive stress testing • Useful for laptop battery drain testing • Portable, no installation required • Small program size • Multilingual interface Supported operating systems: • Windows 11, Windows 10, Windows 8.1, Windows 7, Windows Desktop and MS Server operating systems Supported languages: German, English, Swedish, Danish, Brazilian Portuguese, Slovak, Spanish, Simplified Chinese, French, Italian, Turkish, Czech, Russian, Ukrainian, Greek, Traditional Chinese, Romanian, Korean, Polish, Hungarian, Japanese, Thai, Arabic, Finnish, Frisian, Norwegian, Irish, Dutch, Portuguese, Vietnamese, Persian, Hindi, Hebrew, Spanish-VE, Malay, Indonesian, Filipino, Bosnian, Croatian, Serbian Changes: v5.88 05-13-26 Updated language files in the app for stress-testing Windows PCs, along with minor corrections in the stress-test app for Windows 11 that ensure a smoother PC stress test experience. Click here to visit the author's website. |
|
10,344 | May 17, 2026 SoftwareOK 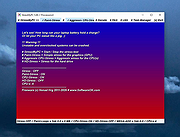 |
|
TimVer v0.14.1 TimVer v0.14.1 👉 Displays Windows version, hardware, drive, graphics, environment, and build history information. TimVer displays the same Windows version information as the built-in Winver command, along with additional system details that Winver does not provide. It can show information about Windows, the computer's hardware, processors, BIOS, memory, disk drives, graphics controllers, environment variables, and Windows build history. TimVer also provides extensive appearance and language options, clipboard functions, portable versions, and settings backup and restore. Features: • Displays Windows version, build number, build branch, architecture, and installation date • Shows computer manufacturer, model, computer name, processor, BIOS, physical memory, and last boot information • Displays logical drive information with optional physical drive details • Shows graphics controller information including adapter name, type, description, resolution, refresh rate, and number of colors • Supports systems with multiple graphics controllers and lets you select each adapter from a dropdown • Displays current environment variables with filtering by variable name • Optionally keeps a history of installed Windows build numbers • Copies an entire supported information page to the clipboard • Copies individual values to the clipboard by right-clicking • Lets you choose the display language • Provides selectable themes, accent colors, fonts, UI sizing, and row spacing • Supports automatic light and dark theme selection when using the System theme • Exports and imports application settings for backup or transfer to another computer • Can open or list the current application settings • Includes an optional check for newer TimVer releases • Runs without elevation for normal system information gathering Supported operating systems: • Windows 10 64-bit, Windows 11 64-bit Supported languages: • English (United Kingdom), English (United States), Spanish, French, Italian, Japanese, Korean, Dutch, Slovak, Thai Changes: v0.14.1 07-25-26 Fixed an issue where mismatched information could be displayed on the Graphics (Video) Information page when two or more video controllers were present. Cleaned up and optimized video controller information retrieval and UI handling. Inactive controllers may show "Not ... |
|
2,284 | Aug 24, 2026 Tim Kennedy 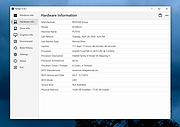 |
|
Tweaking.com - Hardware Identify (PORTABLE) v2.5.0 Tweaking.com - Hardware Identify (PORTABLE) v2.5.0 Tweaking.com - Hardware Identify will help identify unknown hardware on your system. This program does not help you download drivers but helps let you know what the hardware is, so you know what drivers to find. For example, say you just reinstalled a computer and the device manager shows multiple unknown hardware with no drivers installed. Well, you don't know what drivers to find since you don't know what the hardware is. Now with Tweaking.com - Hardware Identify you can see what that hardware is. The program also has an easy option to help improve the device database. Once you have all drivers installed, you can have the program check for any hardware on the system that isn't in the database and submit it to Tweaking.com. Within a few days, the database will be updated, and the device list will grow with the help of users like you! Changes: v2.5.0 Major changes to the graphics and controls of the program. Now supports high DPI systems and has improved graphics. Multiple bug fixes and improvements. Click here to visit the author's website. |
|
9,485 | Jul 02, 2019 Tweaking.com  |
|
USBDeview v3.10 USBDeview v3.10 👉 View, manage, enable, disable, uninstall, and export USB device history. USBDeview is a small utility that lists all USB devices currently connected to your computer, as well as USB devices previously used on the system. For each USB device, it displays extended information including device name, description, device type, serial number, added date/time, Vendor ID, Product ID, and more. USBDeview can also uninstall previously used USB devices, disconnect currently connected USB devices, and disable or enable USB devices. It can also be used on a remote computer when logged in with administrator rights. Features: • Lists currently connected and previously used USB devices • Displays device name, description, type, serial number, Vendor ID, Product ID, and more • Uninstall previously used USB devices • Disconnect currently connected USB devices • Disable and enable USB devices • Remote computer support with administrator login • Command-line options for exporting, sorting, enabling, disabling, removing, and checking USB device status • Export USB device lists to text, tab-delimited, CSV, HTML, and XML files • Available in 32-bit and 64-bit versions Supported operating systems: • Windows 2000, Windows XP, Windows Server 2003, Windows Vista, Windows Server 2008, Windows 7, Windows 8, Windows 10, Windows 11 • 32-bit and 64-bit systems supported Supported languages: English, Arabic, Brazilian Portuguese, Bulgarian, Czech, Danish, Dutch, Euskera, Finnish, French, Galician, German, Greek, Hnidi, Hungarian, Italian, Japanese, Korean, Norwegian, Persian, Polish, Romanian, Russian, Simplified Chinese, Slovak, Spanish, Swedish, Traditional Chinese, Thai, Turkish, Ukrainian, Valencian Changes: v3.10 05-14-26 Added 'Black Background' option (Under the View menu). When it's turned on, the main table is displayed in black background and white text, instead of default system colors. Added 'Save All Items' option (Shift+Ctrl+S). Note: Th3 32bit version of this file has one hit on VirusTotal. We have confirmed this to be a false positive. The file is safe. This download is for the Windows 64bit version (very bottom of ... |
|
10,278 | May 22, 2026 Nir Sofer  |
| Showing rows 1 to 26 of 26 | Showing Page 1 of 1 | 1 |
OlderGeeks.com Copyright (c) 2026
