|
|

|
Processed through Paypal No account required. |
Buy our over-priced crap to help pay the bills.


|
|
|
Processed through Paypal No account required. |
| Files | ||||
| File Name | Rating | Downloads | ||
 |
CoolerControl v4.3.1 CoolerControl v4.3.1 👉 Monitor and control cooling devices, fan curves, RGB lighting, and system temperatures on Linux. CoolerControl is a powerful Linux application for monitoring and managing your PC's cooling hardware from a single modern interface. It combines support for standard hardware monitoring with advanced fan and pump control, custom temperature sensors, RGB lighting management, dashboards, and automation profiles. CoolerControl works with many motherboard sensors, GPUs, AIO liquid coolers, and other supported devices through Linux hardware monitoring frameworks and supported back-end services. The application provides real-time monitoring of temperatures, fan speeds, pump speeds, voltages, utilization, and other hardware statistics while allowing you to create custom fan curves based on multiple temperature sources. Built-in dashboards, profiles, and automation make it easy to optimize cooling for quiet operation, gaming, or maximum performance. Features: • Monitor CPU, GPU, motherboard, storage, and other hardware sensors • Create custom fan and pump curves • Control supported RGB lighting devices • Build custom dashboards for system monitoring • Create and switch between cooling profiles and modes • Use multiple temperature sources for intelligent fan control • Support custom sensors and calculated values • View real-time graphs and historical statistics • Configure alerts and advanced device settings • Support supported liquid coolers, fan controllers, and motherboard sensors • Automatic detection of supported hardware • Modern desktop interface with dark theme support • Includes both desktop application and background daemon Supported operating systems: • Arch Linux • Debian 12 Bookworm or higher • Fedora • NixOS • openSUSE Tumbleweed • Ubuntu 22.04 or higher Supported languages: English Changes: v4.3.1 05-23-26 Added True Duty Mapping calibration for RPM-reporting fans and pumps. Added automatic kick-in boost detection during calibration with configurable behavior. Added disconnected fan and diagnostic reporting during calibration. Added calibration popover with duty-to-RPM relationship graph. Added reset button for Table View statistics. Added quick-menu links for creating Dashboards and Modes. Changed Table View statistics to span the full daemon runtime. Fixed Dashboard time axis display when changing filters in smaller windows. Installation: This download includes ... |
 |
910 | Jul 09, 2026 Guy Boldon |
 |
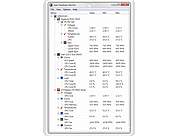
Core Temp v1.19.5 Core Temp v1.19.5 A compact, no fuss, small footprint, yet powerful program to monitor processor temperature and other vital information. What makes Core Temp unique is the way it works. It is capable of displaying a temperature of each individual core of every processor in your system! You can see temperature fluctuations in real time with varying workloads. Core Temp is also motherboard agnostic. All major processor manufacturers have implemented a "DTS" (Digital Thermal Sensor) in their products. The DTS provides more accurate and higher resolution temperature readings than conventional onboard thermal sensors. (How does it work?). This feature is supported by all recent x86 processors. Processors by Intel, AMD and VIA are supported. A complete list of supported processors is available. Core Temp is easy to use, while also enabling a high level of customization and expandability. Core Temp provides a platform for plug-ins, which allows developers to add new features and extend its functionality. You can find the plug-ins and add-ons here. System Requirements: Operating System: Microsoft Windows 11, 10, 8/8.1, 7, XP, 2025 Server, 2022 Server, 2019 Server, 2016 Server, 2012 Server, 2008 Server, 2003 Server. Processor: Intel, AMD or VIA x86 based processor. Changes: v1.19.5 21th September, 2025 - New: Support for Zen 4 AMD processors including ThreadRipper 7000 series, Raphael, Dragon Ridge, Genoa ES, Hawk Point, Phoenix - New: Support for Zen 5 AMD processors including ThreadRipper 9000 series, Granite Ridge, Fire Range, Strix Halo, Strix Point, Krackan Point, Turin - New: Per-CCD and per-core temperature readings for all generations of Zen based processors, most models supported - New: TDP and TjMax detection on most Zen based processors - New: Support for Intel processors including Sapphire Rapids, Emerald Rapids, Granite Rapids, Lunar Lake M, and preliminary Panther Lake - New: Dark Mode (requires Windows 10 or newer OS) - New: Effective core frequency readings + system tray icon - ... |
|
5,112 | Oct 20, 2025 Arthur Liberman |
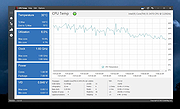 |
CPU Temp v1.3.1.0 CPU Temp v1.3.1.0 A free CPU temperature monitor for Windows. CPU Temp is a free and simple application for CPU Temperature monitoring, compatible with Windows 11 or earlier versions of Windows OS. CPU Temp seamlessly integrates, giving you real-time insights into your CPU's temperature, utilization, clock speed, power consumption, and other essential parameters of your processor. With its intuitive and customizable interface, CPU Temp presents a choice of over 40 different UI themes and color palettes. You can choose and select select UI appearance that resonates with your style, ensuring a tailored and immersive monitoring experience. CPU Temp Application Features CPU Temp uses a clear and intuitive interface to deliver an easy to use solution for CPU temp check, as well as other important CPU metrics. To the left, users will find a navigation bar split into distinct menu items, each correlating to specific functionalities within the application. Home view This is the main view of the CPU Temp Monitor application, and has the following items: • Vertical Tile Items: Located on the left, these tiles provide quick access to various CPU parameters. • Application Chart: Positioned at the center, chart control provides real-time statistics for the indicator represented by the tile item. • CPU Information section: Find a summary of important CPU information at the bottom of the home screen • Thermal Indicator: Conveniently situated next to the app header, this component offers a rapid glance at current thermal states for the CPU. Monitor view Shows detailed information about CPU other hardware sensors such as CPU and GPU temperature, load, clock and others. This information will provide you with comprehensive, real-time insights into PC hardware data. CPU Data Charts view This control offers a detailed view for CPU data. Depending on your platform, ... |
|
1,518 | Nov 15, 2023 CoderBag |
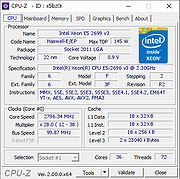 |
CPU-Z v2.20.1 CPU-Z v2.20.1 👉 Free system profiling tool that provides detailed information about your CPU, motherboard, memory, and more. CPU-Z is a lightweight diagnostic utility designed to provide in-depth information about your computer’s hardware. It identifies the processor name and number, codename, process, package, cache levels, and real-time core frequency. It also reports detailed information about the motherboard including chipset, BIOS version, and graphic interface details. CPU-Z displays memory information such as type, size, timings, and specifications (SPD), making it especially useful for verifying RAM configurations. The software also includes a built-in benchmark and stress test to evaluate processor performance and compare results with other systems. Features: • Processor name, codename, architecture, process, package, and cache details • Real-time core frequency and multiplier monitoring • Mainboard manufacturer, model, chipset, and BIOS information • Memory type, size, timings, and SPD data for each module • Graphics interface information • Built-in CPU benchmark and stress test • Validation feature to share system configuration Supported operating systems: • Windows 7, Windows 8, Windows 10, Windows 11 Supported languages: English, French, Spanish, German, Italian, Portuguese, Chinese (Simplified), Chinese (Traditional), Japanese, Korean, Russian Changes: v2.20.1 05-25-26 AMD Ryzen 7 7700X3D (Raphael) (2.20.1). AMD Ryzen AI Max+ 495, 492, 488 (Gorgon Halo). AMD Ryzen AI Max 490, 485 (Gorgon Halo). AMD Ryzen AI Max PRO 495, 490, 485, 480 (Gorgon Halo). AMD Ryzen 9 9950X3D2 (Granite Ridge). AMD Ryzen 9 PRO 9965X3D, PRO 9945 (Granite Ridge). AMD Ryzen 7 PRO 9755, PRO 9745 (Granite Ridge). AMD Ryzen 5 PRO 9645 (Granite Ridge). AMD Ryzen AI 7/PRO 450G/GE (Gorgon Point 2). AMD Ryzen AI 5/PRO 440G/GE (Gorgon Point 2). AMD Ryzen AI 5/PRO 435G/GE (Gorgon Point 3). AMD Ryzen AI Max+ 392 (Strix Halo). Intel Core Ultra 5 250KF Plus (Arrow Lake Refresh). Intel Core 7 360 and 350 (Wildcat Lake). Intel Core 5 330, 320 and 315 (Wildcat Lake). Intel Core 3 304 (Wildcat Lake). Intel Core 9 273PQE, 273PTE, 273PE (Bartlett Lake). Intel Core 7 253PQE, 253PTE, 253PE, 251TE, 251E ... |
|
9,049 | May 26, 2026 CPUID |
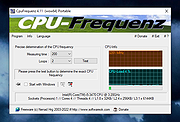 |
CpuFrequenz v4.48 CpuFrequenz v4.48 Small tool for exact determination of the CPU frequency. Every now and then the PC becomes slow. Is it probably due to the CPU? Key Features • Fast and clear Frequency Query • Freely selectable Frequency Detection Duration • Real-Time CPU Load and Frequency Display Other Features and Specifications: • Low CPU and RAM Usage • Optional as a Portable Program • Multilingual (Multilingual) Changes: v4.48 // 13 August 2025 • Important improvement to the CPU Frequency Query Tool on Windows 11 This download is for Windows XP and higher (very bottom of page). If you need the Windows 98 version, download here. Click here to visit the author's website. |
|
5,356 | Aug 17, 2025 Nenad Hrg |
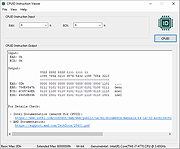 |
CPUID Instruction Viewer v1.0.0.2 CPUID Instruction Viewer v1.0.0.2 Utility to View Information About CPU. CPUID Instruction Viewer is a small utility designed to help developers view technical information returned by the CPUID instruction from the x86 and x86-64 instruction sets. The CPUID instruction returns results about the capabilities and features supported by the processor that this utility is running on. Such results are intended to be viewed along with the accompanying Intel or AMD technical documentation. This utility does not require installation and can be run from any location on the disk. Windows XP/Vista/7/8/10 & Windows Server 2003/R2/2008/R2/2012/R2/2016 Click here to visit the author's website. |
|
3,189 | May 27, 2021 Dennis Babkin |
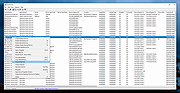 |
DevManView v1.81 DevManView v1.81 👉 Advanced alternative to the Windows Device Manager with enhanced device management tools. DevManView is a lightweight, portable utility that serves as an alternative to the standard Windows Device Manager. Instead of displaying hardware in a tree structure, it presents every installed device in a flat, sortable table with detailed information such as device name, manufacturer, service, driver version, install time, connection status, and more. It also allows you to enable, disable, uninstall, restart, and inspect devices with just a few clicks. DevManView can connect to remote computers (with administrative rights), load device information from an offline Windows installation, export device lists, and includes command-line options for automation and scripting. Features: • Displays all installed devices in a sortable table instead of a tree view • Shows detailed hardware and driver information • Enable, disable, uninstall, or restart devices • View devices on remote computers with administrator access • Load device information from an offline Windows installation • Export device lists to HTML, CSV, XML, or text • Open related Registry keys and INF files • Create desktop shortcuts to enable or disable devices • Powerful command-line support for scripting and automation • Portable application with no installation required Supported operating systems: • Windows XP, Windows Server 2003, Windows Vista, Windows 7, Windows 8, Windows 8.1, Windows 10, Windows 11 Supported languages: • Arabic, Basque, Bulgarian, Catalan, Chinese (Simplified), Chinese (Traditional), Croatian, Czech, Danish, Dutch, English, Finnish, French, German, Greek, Hebrew, Hungarian, Italian, Japanese, Korean, Polish, Portuguese (Brazil), Romanian, Russian, Slovak, Slovenian, Spanish, Swedish, Thai, Turkish, Ukrainian, Vietnamese Changes: v1.81 06-22-26 • Added 'Open Device In Registry Editor' option. • Added 'Open Device In RegEdit' to the right-click context menu. This download is for the Windows 64bit version (very bottom of page). If you need the Windows 32bit version, download here. Click here to visit the author's website. |
|
7,016 | Jun 23, 2026 Nir Sofer |
| Drive Speedometer 1.1.0 Drive Speedometer 1.1.0 Drive Speedometer is a program I made to help monitor the current read and writes speeds of your hard drives. Benefits include: When your system is running slow yet your CPU usage and memory usage are fine, it is normally the hard drive being maxed out. Now you will be able to keep an eye on the hard drive performance. When a drive is slowly dying it will run slower and slower. Being aware of what your normal drive speeds are and seeing those speed drop over time is a great indicator it is time to replace the drive. Being a performance nut myself I like knowing what my system is doing. When I have a program doing some work and appears to be hung up I can see if it is still reading or writing to the drive. This way I know the program isn't hung up and is still working. The program uses the Windows performance counters to pull the information. If you have disabled your performance counters I have included a reg file in the setup to enable them again. Run the reg file and reboot. Your performance counters will be working again. I have also included some pre made bar fill graphics. Including some to use when running the monitor in compact mode. You can of course make your own as well. |
 |
9,803 | Jan 08, 2013 PcWinTech |
|
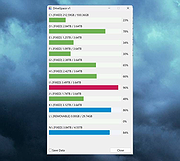 |
DriveSpace v1 DriveSpace v1 Portable tool that displays the percentage of space used on all drives. DriveSpace quickly shows the percentage of space used on up to 12 attached storage devices. How To Use: • Simply run DriveSpace and a window will open showing the storage used on up to 12 attached devices. • If you set the "Save Data" checkbox upon exiting DriveSpace a text file will be created in the DriveSpace directory containing the visible data. Note: This file has two hits on VirusTotal. We have confirmed these to be false positives. The file is safe. Click here to visit the author's website. |
|
386 | Dec 30, 2025 Dan Panke |
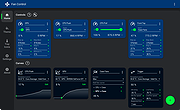 |
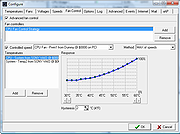
Fan Control v265 Fan Control v265 👉 Highly customizable fan control software for Windows. Fan Control is a focused and highly customizable fan controlling software for Windows that lets you control CPU, GPU, and case fans using temperature-based logic. It supports guided setup, multiple profiles, theme customization, multiple temperature sources, several fan curve functions including custom graphs, mixed fan curves and sensors using max, min, or average logic, low resource usage, and advanced tuning options such as steps, start and stop percentages, response time, and hysteresis. Features: • Guided setup process on first launch • Save, edit, and load multiple profiles • Change the theme and color of the application • Multiple temperature sources including CPU, GPU, motherboard, and hard drives • Multiple fan curve functions, including a custom graph • Mix fan curves or sensors together using max, min, or average • Low resource usage • Advanced tuning with steps, start %, stop %, response time, and hysteresis • Extensive support for CPU, GPU, case fans, and other hardware such as AIOs • Plugin support for adding third-party temperature, speed, or control sensors Fan curve types • Auto: PI-ish type function. % will surf until temp is stable at load. • Linear : Temperature based linear function • Graph : Temperature based custom curve • Target: Temperature based that holds speed until target temperature is reached • Mix : Use two different curves and apply a mix function (Min, Max, Sum, Average) • Sync : Sync to an existing control • Flat: Set a fixed % Graph fan curve editor • Change the temperature range for finer control ... |
|
6,837 | Apr 22, 2026 Rem0o |
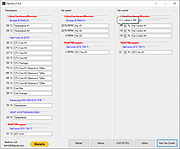 |
FanCtrl v1.4.7 FanCtrl v1.4.7 A free and open source software that allows you to automatically control the fan speed on your PC. Requires .NET framework 4.6 or higher. Visual redistributable 2019(x64) The OSD feature must have the Rivatuner Statistics Server installed and running. Support Motherboard NZXT Kraken x2 and x3 is support (z3 series is not supported) EVGA CLC is support NZXT RGB & Fan Controller is support DIMM thermal sensor is support Show temperature, fan speed and fan control. The percentage of the fan control can be changed to simply control the pwm.(not saved) You can rename each item. Options Gigabyte: AppCenter (Gigabyte Utility) is installed to communicate with AppCenter for temperature, fan speed, and fan control. LibreHardwareMonitor : You can choose whether to use the library or not, and you can choose which devices are required for control. OpenHardwareMonitor : You can choose whether to use the library or not, and you can choose which devices are required for control. NvAPIWrapper : Allows you to add the NVIDIA graphics card control library. DIMM sensor : Support DIMM temperature sensor NZXT Kraken : NZXT Kraken X2, X3 support (Z3 series not supported) EVGA CLC : EVGA CLC support NZXT RGB & Fan Controller : NZXT RGB & Fan controller support HWiNFO : Communicated with HWiNFO to get sensor temperature and fan rpm (Link) Tray icon animation : tray icon animation starts when checked for automatic fan control activation. Fahrenheit : set the temperature to Fahrenheit. Start minimized : starts with minimal when the program runs. Start with Windows : Auto-Run at windows start. Delay(sec) : Delay time before auto-run at windows start. Reset : Initialize all settings and libraries. Auto Fan Control Check to enable automatic fan control, select the temperature sensor to target, add the fan to control, ... |
|
3,582 | Mar 25, 2022 lich426 |
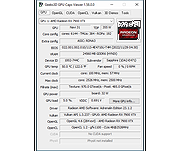 |
GPU Caps Viewer v1.58.0.1 GPU Caps Viewer v1.58.0.1 OpenGL, OpenCL, CUDA APIs and graphics card / GPU information utility GPU Caps Viewer is an OpenGL and OpenCL graphics card utility for Windows. Features: • quick view of the graphics configuration (graphics card / GPU type, amount of video memory, drivers version) • display of the main OpenGL capabilities (OpenGL version, texture size, number of texture units, etc.) • display of OpenCL API support and extensions. • display of the OpenGL extensions supported by your graphics card or display of all existing OpenGL extensions no matter what graphics card you have. For each extension, you can open its description webpage available at the OpenGL Extension Registry or at NVIDIA's OpenGL Extensions spec. Very handy for graphics developers! • display of NVIDIA CUDA level support • display of the system configuration: CPU type and speed, amount of systeme memory, operating system, PhysX version • display of the GPU core temperature • GPU Burner or Stability Test: allows to overheat the GPU in order to test the graphics card stability. You can start several stress test demos in the same time in order to make your graphics card working to the maximum. • list of links related to your graphics card: graphics drivers and graphics cards reviews. These links are regularly updated. • full report in text and XML format. This kind of report is useful for developers who needs an outline of the customer graphics system (for support purposes for example). • graphics card validation: your graphics card data is sent to oZone3D.Net server and in return you receive a link on the validation ... |
|
2,027 | Feb 03, 2023 Ozone3D |
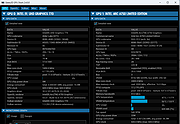 |
GPU Shark II v2.4.0.0 GPU Shark II v2.4.0.0 A GPU/graphics card information and monitoring utility for Windows. It can monitor the main hardware sensors (temperatures, usages, clock speeds, power) of the graphics hardware (GPU, VRAM) and offers an overview of the 3D APIs support level (OpenGL and Vulkan). GPU Shark 2 is made with GeeXLab. The 64-bit version of GPU Shark 2 can monitor all modern GPUs (NVIDIA GeForce, AMD Radeon, Intel Arc and Moore Threads MTT S80/S70) while the 32-bit version is limited to GeForce and Radeon GPUs only. Intel UHD Graphics 770 + Arc A750 NVIDIA GeForce RTX 2070 + GeForce GT 1030 Changes: v2.4.0.0 - 2024.09.30 - added support of Intel Arc 140V iGPU (Lunar Lake) - added new theme colors. - added About panel - added GL_SHADING_LANGUAGE_VERSION in the OpenGL panel. - improved monitoring of Intel integrated GPUs: added support of GPU usage and power sensors. - improved monitoring of Intel Arc GPUs. - added VRAM temperature for Arc GPUs. - updated with GeeXLab 0.60.2 libs. - various small bug fixes. This download is for the Windows 64bit installer version (very bottom of page). All other download assets are below: Use 7-Zip to unzip this file. No installer: gpushark2_2.4.0.0_win64.7z gpushark2_2.4.0.0_win32.7z Click here to visit the author's website. |
|
724 | Oct 10, 2024 Ozone3D |
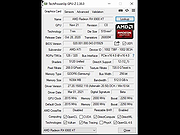 |
GPU-Z v2.68.0 GPU-Z v2.68.0 A lightweight system utility designed to provide vital information about your video card and graphics processor. Main Features • Supports NVIDIA, AMD, ATI and Intel graphics devices • Displays adapter, GPU and display information • Displays overclock, default clocks and 3D/boost clocks (if available) • Detailed reporting on memory subsystem: memory size, type, speed, bus width vIncludes a GPU load test to verify PCI-Express lane configuration • Validation of results • GPU-Z can create a backup of your graphics card BIOS • No installation required, optional installer is available • Support for Windows 11 / Windows 10 / Windows 8 / Windows 7 / Vista / Windows XP (both 32 and 64 bit versions are supported) • .. and yes, the author of CPU-Z has granted us permission to use a name similar to his product. Thanks Franck. Changes: v2.68.0 (August 13th, 2025) Added support for NVIDIA GeForce RTX 5050 Laptop, RTX Pro 2000 Blackwell Laptop, RTX 3050 A Laptop Added support for Moore Threads S3000E Improved driver file security during unpacking Fixed crash after running installer Fixed bluescreen on startup on Arm64 devices Updated "Monster Notebook" vendor name to "Monster Computer" Click here to visit the author's website. |
|
11,000 | Aug 18, 2025 Techpowerup |
 |
HWiNFO v8.50 HWiNFO v8.50 👉 Professional hardware information, real-time monitoring, and diagnostics for Windows and DOS systems. HWiNFO is a comprehensive hardware analysis, system information, diagnostics, and real-time monitoring utility designed for enthusiasts, technicians, and IT professionals. It provides detailed information about virtually every hardware component in your computer while continuously monitoring temperatures, voltages, fan speeds, power usage, clocks, storage health, and many other sensor values. HWiNFO also generates comprehensive hardware reports, supports extensive logging, and integrates with numerous third-party monitoring applications through its shared memory interface. Features: • In-depth hardware information with detailed analysis of system components • Real-time monitoring of CPUs, GPUs, mainboards, drives, and peripherals • System health monitoring designed to help detect overheating, overload, performance loss, or possible failure • Extensive reporting with full hardware hierarchy or quick summary overview • Export reports in XML, CSV, and HTML formats • Customizable monitoring tables, graphs, tray icons, and OSD • Customizable alerts on monitored parameters with user-defined actions • Support for interfacing with other applications and third-party extensions • Shared Memory interface support for exposing sensor data • Clean and secure design with no personal data collection and no network transmission • Frequently updated to support new hardware, technologies, and standards Supported operating systems: • Windows 95 and later (x86, x64 or ARM64) Supported languages: English, French, German, Spanish, Portuguese (Brazil), Italian, Dutch, Danish, Chinese (Simplified), Chinese (Traditional), Japanese, Korean, Vietnamese, Arabic, Russian, Ukrainian, Czech, Slovak, Hungarian, Polish, Swedish, Finnish, Norwegian, Greek, Turkish, Latvian, Hebrew Changes: v8.50 07-08-26 Added fan speed monitoring on MSI Claw 8. Improved Intel Nova Lake support. Enhanced sensor monitoring on Maxsun 275HX series. Updated Intel PresentMon. Added monitoring of measured Core, Memory and XBAR clocks on NVIDIA GPUs. Fixed lost Custom and WHEA sensors. Added reporting of ACPI version. Improved Corsair Link device support. Added Display Audio monitor capability information. Added option to change OSD background color. Fixed recognition of AMD Radeon RX 6500XT. Fixed a possible crash when sensor name is too long. This ... |
|
13,068 | Jul 09, 2026 REALiX |
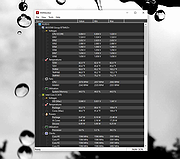 |
HWMonitor v1.65 HWMonitor v1.65 👉 Hardware monitoring tool that displays real-time system sensor data. HWMonitor is a hardware monitoring program that reads PC system health sensors to display voltages, temperatures, fan speeds, and power consumption in real time. It provides a clear and organized view of key hardware metrics gathered from onboard sensors, helping users monitor system stability and performance. HWMonitor supports a wide range of hardware including CPUs, GPUs, motherboards, and storage devices. It can read data from SMART-enabled hard drives, temperature sensors, and voltage rails, making it useful for diagnosing overheating issues or checking system performance under load. The interface is simple and lightweight, showing minimum, maximum, and current values for each sensor, allowing users to track changes over time without unnecessary clutter. Features: • Monitors temperatures, voltages, fan speeds, and power usage • Displays minimum, maximum, and current sensor values • Supports CPUs, GPUs, hard drives, and motherboards • Reads SMART data from storage devices • Lightweight and portable-friendly operation • Simple, easy-to-read interface Supported operating systems: • Windows XP, Windows Vista, Windows 7, Windows 8, Windows 10, Windows 11 Supported languages: English Changes: v1.65 07-14-26 Hotspot temperature on NVIDIA RTX 50x0 GPUs. Preliminary support of Lisuan 7G100 GPU. This download is for the Windows 32bit/64bit version (very bottom of page). If you need the Windows ARM64 version, download here. Click here to visit the author's website. |
|
7,387 | Jul 15, 2026 CPUID |
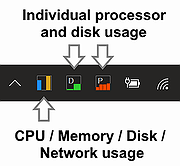 |
Icon-Meter v2.4.1 Icon-Meter v2.4.1 A small "notifyicon" system performance meter for Windows. Icon-Meter is a Small notifyicon system performance meter for MS Windows, running on Microsoft Windows 7 or above using the Microsoft .NET Framework. Features: • Customizable bar colors • Optionally hide / display bars of memory, disk and network performance (Version 1.1) Visualize individual logical processor usage • Use vertical or horizontal bars • Autostart when Windows start up • Quick launch for Task Manager • Display numerical readings in popup tooltip message when mouse cursor hovers over the meter Usage: • Left click the meter icon to show the popup window. • Right click the meter icon to access the setup dialog (setup menu item), or to close the program (Close menu item). • All settings could be found in the setup dialog. • Double left click the meter to launch the system Task Manager. • Currently 4 languages (traditional Chinese, simplified Chinese, English and Japanese) are supported, please switch to a new display language of your system to change the language. Changes: v2.4.1 03-24-25 Thanks for the contribution of @uDEV2019, Icon Meter now supports German language. What's Changed German Translation by @uDEV2019 in #2 Click here to visit the author's website. |
|
880 | Mar 26, 2025 Oscar Kin-Chung Au |
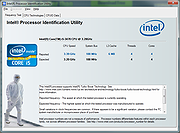 |
Intel Processor Identification Utility 5.25 Intel Processor Identification Utility 5.25 This utility is designed to identify current Intel® Processors and technologies, and enables you to run and save a processor ID report. The utility also features a frequency test to make sure that the processor is working at the rated speed. Operating System: Windows XP Professional x64 Edition*, Windows Server 2003 Standard x64 Edition*, Windows Server 2003 Enterprise x64 Edition*, Windows Vista *, Windows Server 2008 *, Windows 7 *, Windows 2000 *, Windows 8*, Windows 8.1*, Windows XP Professional*, Windows XP Home Edition*, Windows Server 2003 Standard Edition* This applies to: Intel® Atom™ Processor Intel® Core™ Duo Processor Intel® Core™ i3 Desktop Processor Intel® Core™ i3 Mobile Processor Intel® Core™ i5 Mobile Processor Intel® Core™ i7 Mobile Processor Intel® Core™ i7 Mobile Processor Extreme Edition Intel® Core™ i7 Processor Extreme Edition Intel® Core™ M Processors Intel® Core™ Solo Processor Intel® Core™2 Duo Desktop Processor Intel® Core™2 Duo Mobile Processor Intel® Core™2 Extreme Mobile Processor Intel® Core™2 Extreme Processor Intel® Core™2 Quad Mobile Processor Intel® Core™2 Quad Processor Intel® Core™2 Solo Processor Intel® Pentium® 4 Processor Extreme Edition Intel® Pentium® 4 Processors Intel® Pentium® D Processor Intel® Pentium® Processor Intel® Pentium® Processor Extreme Edition Intel® Pentium® Processor for Desktop Intel® Pentium® Processor with MMX™ Technology Intel® Processor Identification Utility |
|
7,329 | Jun 20, 2015 Intel |
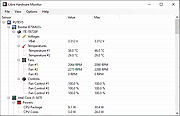 |
Libre Hardware Monitor v0.9.6 Libre Hardware Monitor v0.9.6 👉 Free and open source hardware monitoring software for temperatures, fan speeds, voltages, loads, and clock speeds. Libre Hardware Monitor is free software that can monitor the temperature sensors, fan speeds, voltages, load and clock speeds of your computer. The project includes a Windows Forms application and a library for developers, and it can read information from devices such as motherboards, Intel and AMD processors, NVIDIA, AMD and Intel graphics cards, HDD, SSD and NVMe drives, and network cards. Features: • Monitors temperature sensors, fan speeds, voltages, loads, and clock speeds across supported hardware. • Reads detailed data from motherboard sensors including chipsets and embedded controllers. • Supports monitoring for Intel and AMD CPUs including per-core metrics. • Supports NVIDIA, AMD, and Intel GPUs with temperature, clock, and voltage reporting. • Monitors storage devices including HDD, SSD, and NVMe drives with SMART data support. • Displays real-time system load and performance metrics. • Provides a clean Windows Forms interface for easy viewing of all sensor data. • Includes a developer-friendly library for integrating hardware monitoring into other applications. • Supports additional devices such as network cards where sensor data is available. • Offers a remote monitoring interface via built-in web server (/metrics endpoint). • Allows exporting sensor data for external monitoring tools. • Expands support for modern chipsets, motherboards, and controllers. • Detects and displays multiple sensors per device where available. • Provides continuous real-time updates of hardware status. Supported operating systems: • Windows 11, Windows 10 22H2 or later for the .NET 10 build. • Windows 7 SP1, Windows 8.1, Windows 10 version 1607 or later for the .NET Framework 4.7.2 build. Supported languages: English, German, Spanish, French, Italian, Japanese, Polish, Russian, Swedish, Turkish, Chinese (Simplified), Chinese (Traditional) Changes: v0.9.6 02-14-26 Update DiskInfoToolkit. GA-A320M add missing controls. Feature/arctic fan controller. Bump System.IO.Ports from 10.0.1 to 10.0.2. Bump System.Management from 10.0.1 to 10.0.2. Bump System.Threading.AccessControl from 10.0.1 to 10.0.2. Bump System.Text.Json from 10.0.1 to 10.0.2. Bump ... |
|
3,724 | Apr 22, 2026 LibreHardwareMonitor |
 |
My System Monitor 1.12 My System Monitor 1.12 My System Monitor is a smart utility docked in the top of Windows desktop which display: - hard disk drive and flash drive read / write activity and speed - cpu usage - free memory - lan, adsl and wifi download and upload speed Changelog: Version 1.12: - (fixed) new drives connected are not recognized automatically - (fixed) on multi user system when switching back to a desktop with My System Monitor, the dock area may not be restored correctly - option "always on top" now works properly - various fix |
|
5,902 | May 23, 2017 My Portable Software |
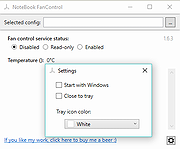 |
NBFC - Notebook FanControl v1.6.3 NBFC - Notebook FanControl v1.6.3 NBFC is a fan control service for notebooks. It comes with a powerful configuration system, which allows to adjust it to many different notebook models. Windows Run the NBFC installer Start NoteBook FanControl.exe (by default located in C:\Program Files (x86)\NoteBook FanControl) Select a config. As soon as you hit the apply button, NBFC should take control over your notebook’s fans. There is no additional configuration required. The NBFC service will start automatically. If you want to adjust the selected config according to your needs, edit it in the Config Editor. 1.6.3 Most important changes: Support for Intel CoffeeLake, ApolloLake and AMD Ryzen CPUs (thanks @dan-and) Support for AMD Puma CPUs Support for many new notebook models ec-probe now supports colored output Improved settings file handling Lots of stability improvements and bugfixes Click here to visit the author's website. |
|
5,079 | Apr 16, 2019 Stefan Hirschmann |
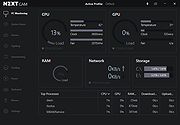 |
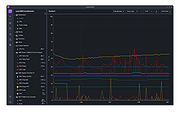
NZXT CAM v4.34.1 NZXT CAM v4.34.1 The Best Gaming PC Monitoring App Manage performance, temperatures, and devices all from a single application. NZXT CAM is fast, efficient, and easy-to-use, allowing you to control every aspect of your computer. Game Sync Set your lights and fans to change whenever you launch one of our thousands of supported games. Match the colors of the game, change your lights to respond to the in-game audio, or turn all of your lights off for a competitive edge. Smart Scheduling Customize the behavior of your fans and lighting for different times of day. Set your lights to slowly turn on as your day begins, your cooling devices to run at higher power in the heat of the afternoon, or for your lights to shut off automatically as a bedtime reminder. Complete Customization Match your computer to how you use it, any time of day or night. CAM will make it so lights and cooling devices will help bring you more into the game than ever before. Track Every Aspect of Your Computer NZXT CAM empowers you to see what your computer is doing, from processor load to bandwidth consumption. With CAM you can monitor how running applications are making use of every part of your gaming PC. You can quickly track down any issues to ensure that you’re getting the optimal performance out of your computer. In-Game Monitoring Performance matters most when you’re in-game. Track your FPS, temperatures, bandwidth, and more with our low-impact, super-stable in-game overlay. Make the most out of your computer. CAM SUPPORTED FEATURES Current FPS CPU / GPU Temperature Time Played Battery Level CPU / GPU Load Many more! Click here to visit the author's website. |
|
9,315 | Mar 22, 2022 NZXT Inc. |
 |
Open Hardware Monitor v0.9.6 Open Hardware Monitor v0.9.6 The Open Hardware Monitor is a free open source software that monitors temperature sensors, fan speeds, voltages, load and clock speeds of a computer. The Open Hardware Monitor supports most hardware monitoring chips found on todays mainboards. The CPU temperature can be monitored by reading the core temperature sensors of Intel and AMD processors. The sensors of ATI and Nvidia video cards as well as SMART hard drive temperature can be displayed. The monitored values can be displayed in the main window, in a customizable desktop gadget, or in the system tray. The free Open Hardware Monitor software runs on 32-bit and 64-bit Microsoft Windows XP / Vista / 7 / 8 / 8.1 / 10. Supported Hardware CPU core sensors Intel Core 2, Core i3/i5/i7, Atom, Sandy Bridge, Ivy Bridge, Haswell, Broadwell, Silvermont, Skylake, Kaby Lake, Airmont, Goldmont, Goldmont Plus, Cannon Lake, Ice Lake, Tremont, Tiger Lake AMD K8 (0Fh family), K10 (10h, 11h family), Llano (12h family), Fusion (14h family), Bulldozer (15h family), Jaguar (16h family), Puma (16h family), Ryzen (17h family) Mainboard sensors ITE IT8620E, IT8628E, IT8655E, IT8665E, IT8686E, IT8688E, IT8705F, IT8712F, IT8716F, IT8718F, IT8720F, IT8721F, IT8726F, IT8728F, IT8771E, IT8772E, IT8792E/IT8795E Fintek F71808E, F71858, F71862, F71868AD, F71869, F71869A, F71882, F71889ED, F71889AD, F71889F Nuvoton NCT6102D, NCT6106D, NCT6771F, NCT6772F, NCT6775F, NCT6776F, NCT6779D, NCT6791D, NCT6792D, NCT6792D-A, NCT6793D, NCT6795D, NCT6796D, NCT6796D-R, NCT6797D, NCT6798D Winbond W83627DHG, W83627DHG-P, W83627EHF, W83627HF, W83627THF, W83667HG, W83667HG-B, W83687THF GPU sensors Nvidia ... |
|
4,781 | Dec 28, 2020 Michael Möller |
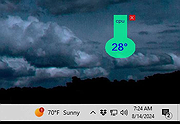 |
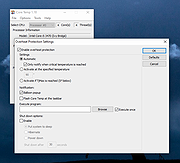
ProcTemp v2.0 ProcTemp v2.0 A lightweight gadget for Windows which will help you monitoring the temperature of your processor. When your CPU temperature reaches 60°, the color will turn to orange. When it reaches 70°, it will turn to red. You can drag and drop the gadget across the desktop, and minimize it with a double-click. No install is needed. ProTemp runs as a single file, leaves no temporary files and does not touch your Registry. |
|
756 | Aug 14, 2024 Jean-Marie Barone |
 |
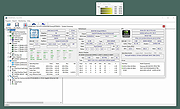
SpeedFan 4.52 SpeedFan 4.52 SpeedFan is a program that monitors voltages, fan speeds and temperatures in computers with hardware monitor chips. SpeedFan can even access S.M.A.R.T. info and show hard disk temperatures. SpeedFan supports SCSI disks too. SpeedFan can even change the FSB on some hardware (but this should be considered a bonus feature). SpeedFan can access digital temperature sensors and can change fan speeds accordingly, thus reducing noise. SpeedFan works fine with Windows 9x, ME, NT, 2000, 2003, XP, Vista, Windows 7, 2008, Windows 8, Windows 10 and Windows Server 2012. It works with Windows 64 bit too. Changelog: 4.52 - added full IPMI support - added full support for IT IT8771E - added full support for Intel Sunrise Point (Z170) SMBus - added full support for STMicro STTS2004 - added full support for NCT6793D - added full support for Giantec GT34TS04 and GT34TS02 - added support for Atom E3800 SMBus - added support for Atom C2000 SMBus - added support for Fintek F71878A/F71868A at non standard addresses - enabled SMBus on Intel 6 Series / C20x, if needed - fixed SCSI_PASS_THROUGH access on some systems - skipped accessing those hard disks that return the ID Sector from another disk - fixed Nuvoton NCT6791D and NCT6792D sixth fan readings - added support for alternate registers of NCT6793D - fixed German translation for CPU Usage |
|
9,851 | Jun 30, 2016 Alfredo Milani Comparetti |
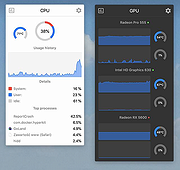 |
Stats v2.11.61 Stats v2.11.61 A free macOS system monitor for your Menu Bar. Stats is a simple, lightweight app that helps you monitor your mac's performance. Get a comprehensive view of your mac's health. Features: • CPU usage and processes monitoring. • GPU usage and processes monitoring. • RAM usage and processes monitoring. • Disk space and usage monitoring. • Sensors and fans monitoring. • Network I/O monitoring. • Battery level monitoring. • Bluetooth devices and their batteries monitoring. • Clock and calendar in your menu bar. Supported operating systems: macOS 10.14 (Mojave) macOS 10.13 (High Sierra) For macOS 10.15 (Catalina) and later Changes: v2.11.61 11-14-25 fix: reverted enabling macOS widget updates since there is still a problem with chronod (#2733) How to install: Manual install 1) Download the latest version for youe macOS version below. 2) Open it and move the app to the application folder. Homebrew Install 1) Open the Terminal app. 2) Type: brew install stats and hit ENTER. This download is for the macOS 10.15 (Catalina) and later version (very bottom of page). If you need the macOS 10.14 (Mojave) version, download here. If you need the macOS 10.13 (High Sierra) version, download here. Click here to visit the author's website. |
|
420 | Nov 14, 2025 Serhiy Mytrovtsiy |
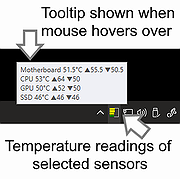 |
Temperature Icon Meter v2.4 Temperature Icon Meter v2.4 A small "notifyicon" system temperature meter for Windows. It displays small notifyicon which visualize the user selected current temperature readings in small bars. Also it will record the minimum and maximum temperature readings during its running. The temperature readings is collected via WMI interface provided by Open Hardware Monitor. Features: • Customizable bar colors for safe / warning / danger temperatures ranges. • Customizable temperature ranges (safe / warning / danger). • Customizable display names for any detected temperature sensors. • Use vertical or horizontal bars • Autostart when Windows start up • Display numerical readings in popup tooltip message when mouse cursor hovers over the meter Usage: • Left click the meter icon to show the popup window. • Right click the meter icon to access the setup dialog (setup menu item), or to close the program (Close menu item). • Select the check box of a temperature sensor to include it in the notifyicon and make it highlighted in the popup window. • Click the blue link to edit the display name of any temperature sensor, the display name will be shown in the popup tooltip and popup window. • Currently 4 languages (traditional Chinese, simplified Chinese, English and Japanese) are supported, you can select your desired language in the setup dialog. • All settings could be found in the setup dialog. Notes: • Temperature Icon Meter needs user to confirm the UAC (User Account Control) prompt during its first run, and it should start automatically without interruption next time if you enable the Run at Startup option. • Temperature Icon Meter ... |
|
781 | Mar 20, 2025 Oscar Kin-Chung Au |
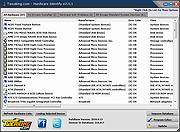 |
Tweaking.com - Hardware Identify (PORTABLE) v2.5.0 Tweaking.com - Hardware Identify (PORTABLE) v2.5.0 Tweaking.com - Hardware Identify will help identify unknown hardware on your system. This program does not help you download drivers but helps let you know what the hardware is, so you know what drivers to find. For example, say you just reinstalled a computer and the device manager shows multiple unknown hardware with no drivers installed. Well, you don't know what drivers to find since you don't know what the hardware is. Now with Tweaking.com - Hardware Identify you can see what that hardware is. The program also has an easy option to help improve the device database. Once you have all drivers installed, you can have the program check for any hardware on the system that isn't in the database and submit it to Tweaking.com. Within a few days, the database will be updated, and the device list will grow with the help of users like you! Changes: v2.5.0 Major changes to the graphics and controls of the program. Now supports high DPI systems and has improved graphics. Multiple bug fixes and improvements. Click here to visit the author's website. |
|
9,269 | Jul 02, 2019 Tweaking.com |
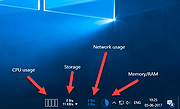 |
XMeters Free v1.0.103.0 XMeters Free v1.0.103.0 Taskbar System Stats for Windows Keep tabs on your vital system information Real-time System Monitoring Display a live view of your most important system information at all times. Completely Customizable Change the look of XMeters to match your workspace. Designed for Performance XMeters is designed to be as lightweight and battery-friendly as possible. CPU Monitoring Storage Monitoring Network Monitoring Memory Monitoring Customizable Colors Configurable Meter Types Click here to visit the author's website. |
|
6,149 | Dec 16, 2019 entropy6 |
| Showing rows 1 to 29 of 29 | Showing Page 1 of 1 | 1 |
OlderGeeks.com Copyright (c) 2026
