|
|

|
Processed through Paypal No account required. |
Buy our over-priced crap to help pay the bills.


|
|
|
Processed through Paypal No account required. |
| File - Download Venmon v2.37 | ||||||||
| Description | ||||||||
|
A plea... Deanna and I have been running this site since 2008 and lately we're seeing a big increase in users (and cost) but a decline in percentage of users who donate. Our ad-free and junkware-free download site only works if everyone chips in to offset the revenue that ads on other sites bring in. Please donate at the bottom of the page. Every little bit helps. Thank you so much. Sincerely, your Older Geeks: Randy and Deanna Always scroll to the bottom of the page for the main download link. We don't believe in fake/misleading download buttons and tricks. The link is always in the same place. Venmon v2.37 👉 Compact system monitoring and multi-ping tool for Windows. Venmon is a system resource monitoring and multi-ping tool for Windows. It can monitor system memory, processor, battery life, uptime, idle time, graphic cards, network traffic, event logs, and drives while using minimal processing power and memory. It displays real-time statistics, can run in portable mode from a USB drive, and does not require the installation of runtime modules. System The main screen of Venmon displays a general system summary, memory usage, processor usage, battery status, uptime, and idle time. System events will report activities such as Page file changes, battery activity (percentage charged/plugged/unplugged/charging/not charging), allocated memory changes, and report periods of long idle times. Long idle times can be used to see when someone last used the computer. 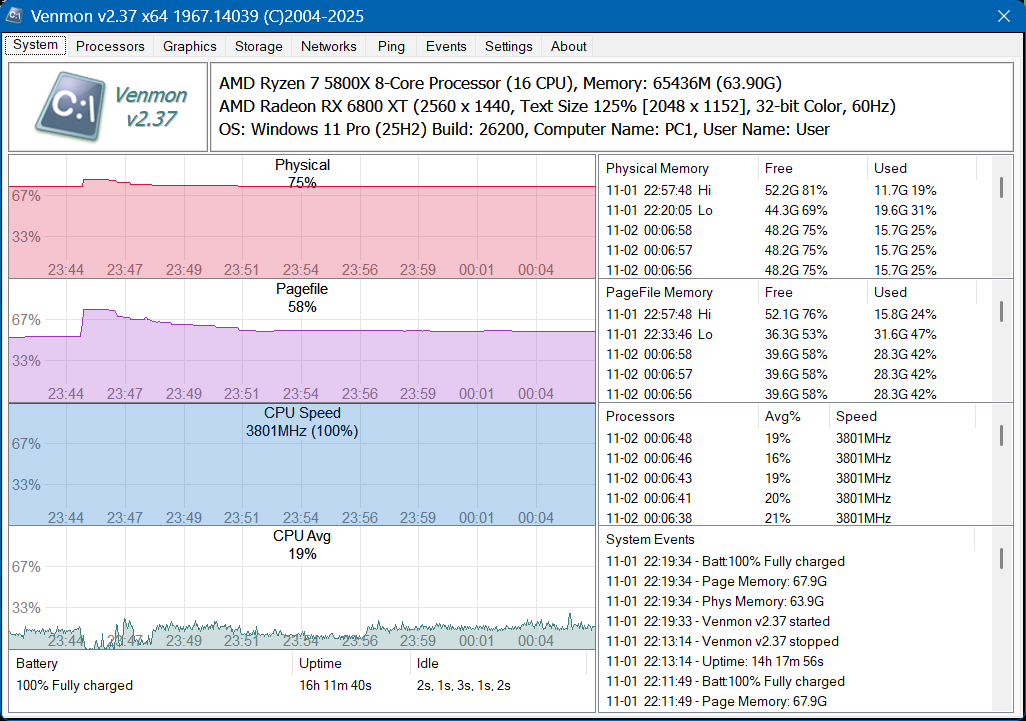 Features: • Monitors memory, processor, battery life, uptime, idle time, graphics cards, network traffic, event logs, and drives • Displays real-time system statistics with low resource usage • Includes a multi-ping tool with support for up to 1024 automated pings by IP address or host name • Provides history graphs and event logging for system, storage, network, and ping activity • Supports portable use from a USB drive with settings saved locally • Includes Event Viewer, drive monitoring, network monitoring, and system tray features • Portable Supported operating systems: • Windows 7, Windows 8, Windows 10, Windows 11 • Windows Server 2000, Windows Server 2003, Windows Server 2008, Windows Server 2012, Windows Server 2016, Windows Server 2019, Windows Server 2022, Windows Server 2025 Supported languages: English, German Changes: v2.37 11-02-25 • Added Control + Mouse Wheel Down while hovering over Mini Window to make font size smaller • Added Control + Mouse Wheel Up while hovering over Mini Window to make font size bigger • Added Control + Mouse Wheel Down while hovering over Ping List to make font size smaller • Added Control + Mouse Wheel Up while hovering over Ping List to make font size bigger Processors Added in v2.11. This display shows the main processor statistics. These include Base Speed, Brand, CPU Description, L2 and L3 Cache, Cores and Logical, (Current) Speed, Load Percentage, the number of Windows' Processes, Handles, and Threads, P-State and C-States. Each graph represents one logical core. Venmon can display up to 144 core processors. The temperature readings requires Core Temp to be running in the background. 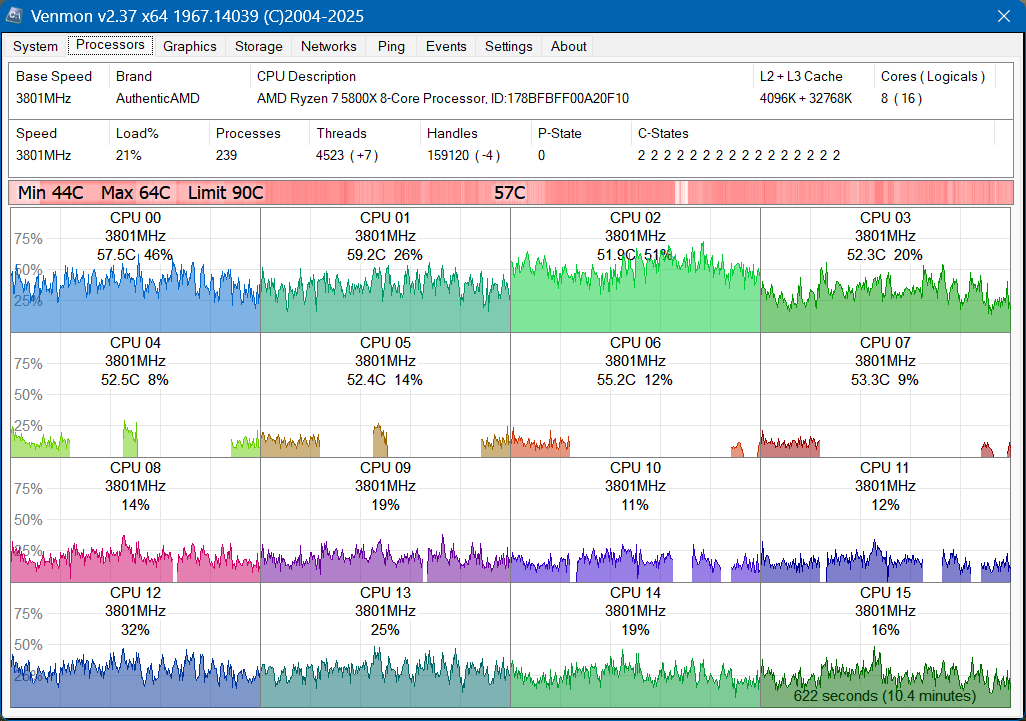 Graphics Added in v2.31. This feature is only available in the 64-bit edition and currently supports NVidia and AMD video cards. This screens will show the history, statistics and graphs for up to eight supported video cards. Each video card will get their own graphs and temperature bar. Data shown on this page include Names, IDs, Clock Speeds, PCIe Bus, Power, Temperature, InfoRoms Data, Memory Usage, Modes/States, Fan Speed, GPU/Memory Utilization, ECC Errors, Driver Versions, Hardware Limits, and more. 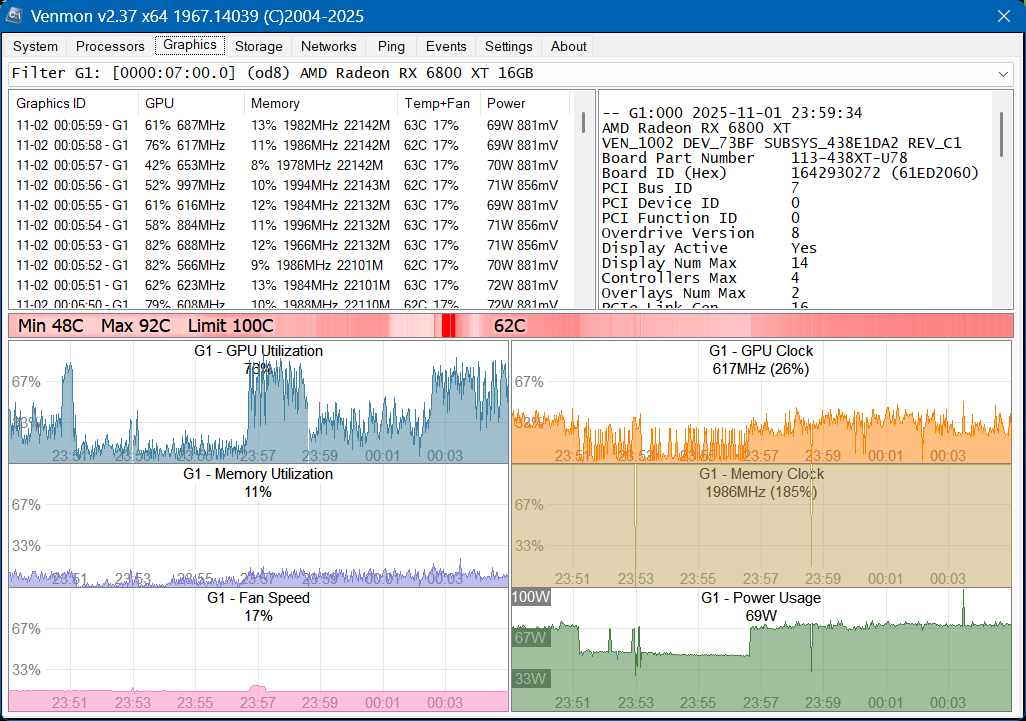 Storage This screen displays all the available local and remotely mapped network-attached drives connected to your PC. A filter can show activity from a particular drive. Storage monitor records activity changes such as inserted and removed media (including USB sticks or external drives), drive space changes, new partitions, volume name changes and disk reported errors. Reading and writing auto-adjusting graphs display drive usage. 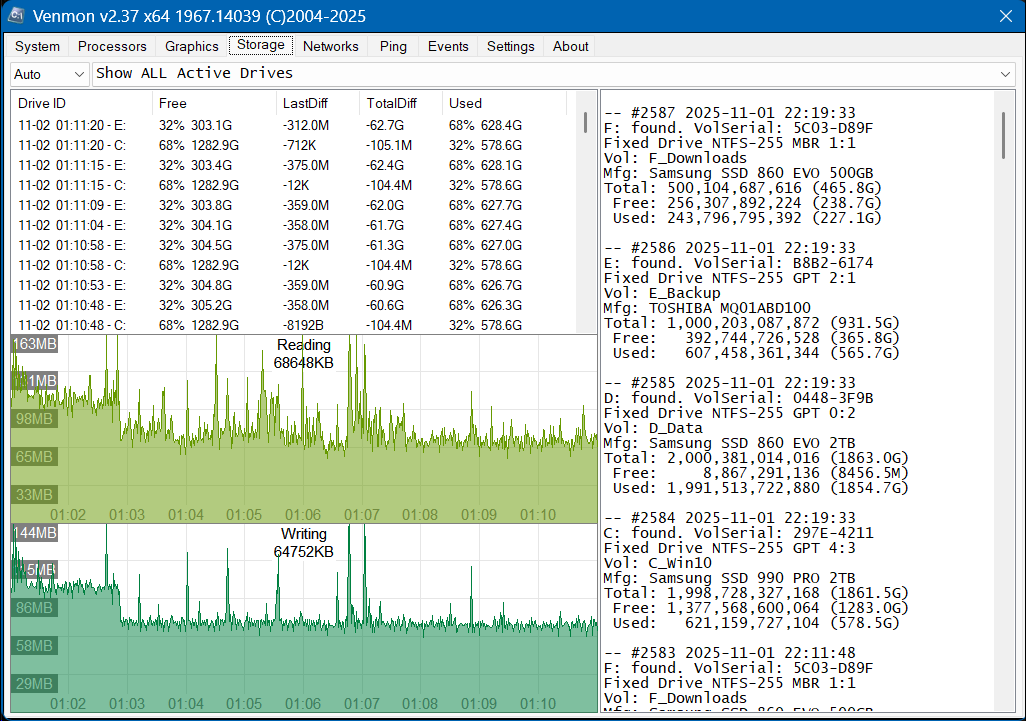 Networks Added in v2.08. The network screen displays up to 32 network connections and displays the data usage in bytes or packets. The network connection list will show both hardware and software-based network connections, both active and inactive. Sending and receiving auto-adjusting graphs will display traffic and can be set for real-time traffic mode in the settings screen. Network events will post messages about wireless connection speeds, sending/receiving errors, internet connections, IP address changes, operation status (up/down/testing), and more. 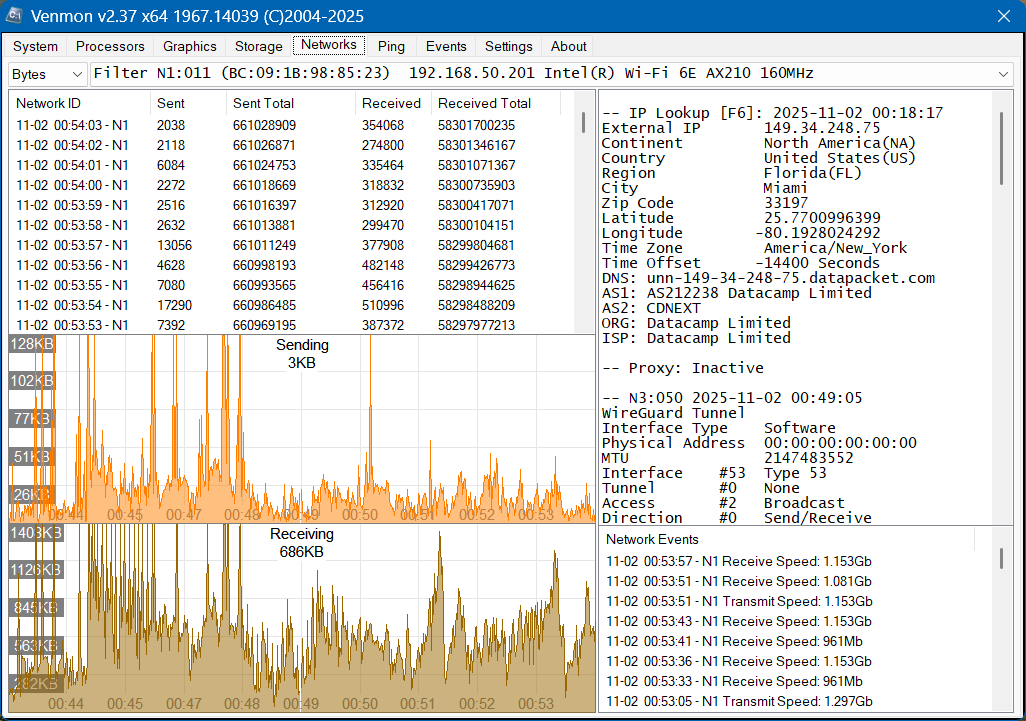 Ping Added in v2.24. The Ping tool includes the ability to add up to 1024 automated Pings by IP address or Hostnames with an adjustable time interval. Displays IP address, hostnames, time in ms, TTL, TOS, received, lost, lost %, and timeline with response time filter. Pings can be deleted, paused or reset individually or in a selected group. Multiple pings are spread across all processor cores to balance CPU load. Ping data is saved into a JSON file hourly or on program closure. Yellow lines are slow response times set by timeout setting between 50 to 800 ms, red lines are pings that timed out, and blue lines indicate that data is missing possibly from a system or program restart. Each timeline point can be mouse hover over with more details or right-clicked to export all data to the clipboard ready to be pasted into an email or text document. Export to a spreadsheet using CTRL+X. 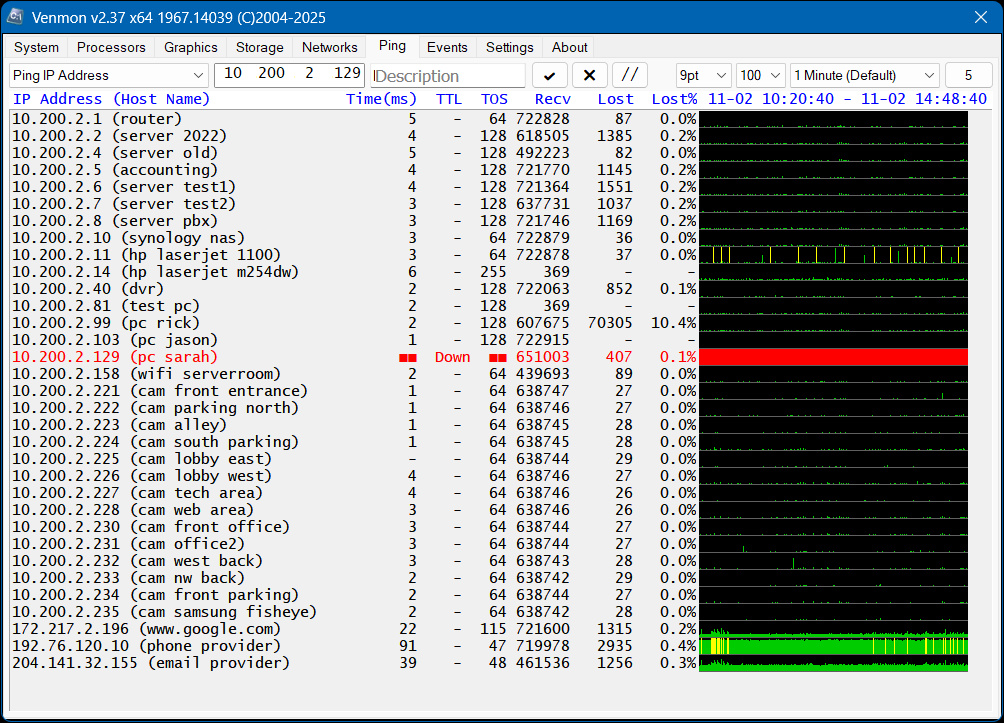 Events Viewer Added in v2.34. Automatically detects active events log from your system and displays contents. Can be used for find errors, when services items are run such as updates, time service, system restore points, etc.. Filters include number of days (or Forever) and the ability to search by Description, Source, Record, or Event ID. When an item is selected, details are shown in the bottom portion of the screen. Events are auto-refreshed as the log file is updated. 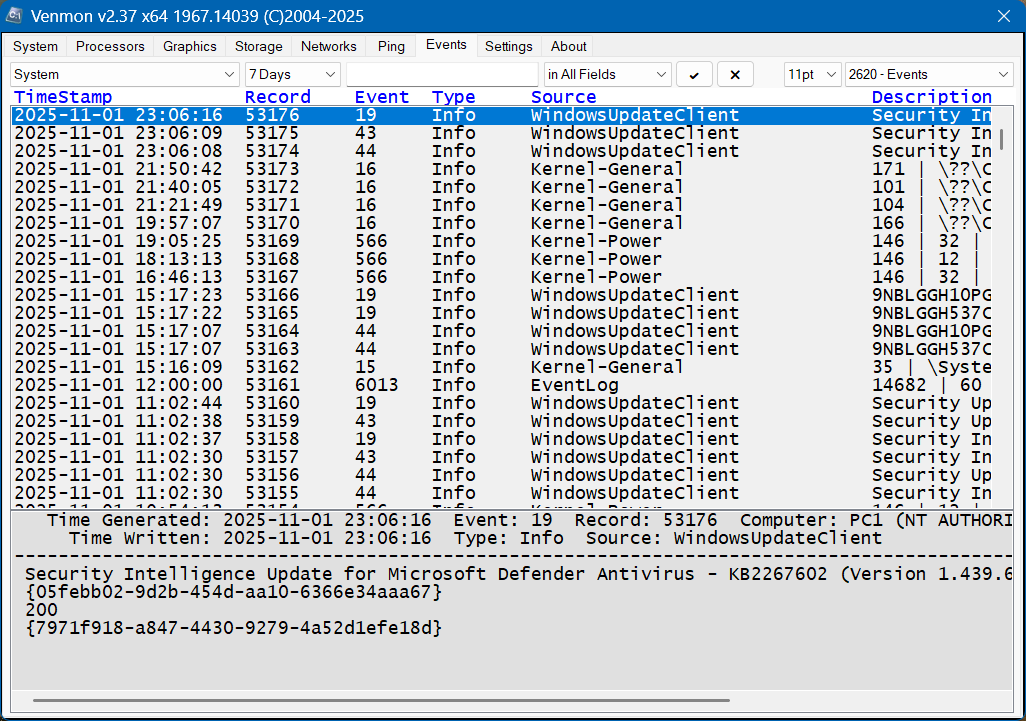 Settings The settings screen is where you can customize the appearance and usage of Venmon. Each setting has a hover-over tool-tip. Settings take effect immediately and are auto-saved. If Venmon is running in Portable mode, determined if it's running off a removable drive, it can save settings to the same drive rather than on a user's computer. Custom settings will be carried over on the USB drive between computers. 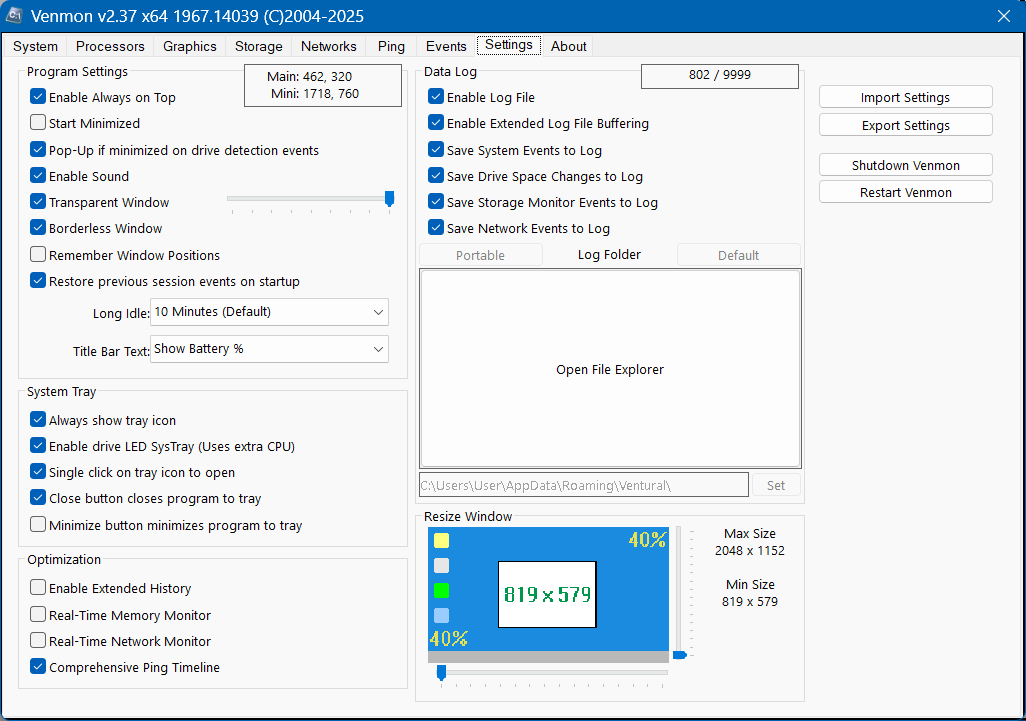 Note: This file has three hits on VirusTotal. We have confirmed these to be false positives. The file is safe. Click here to visit the author's website. Continue below for the main download link. |
||||||||
| Downloads | Views | Developer | Last Update | Version | Size | Type | Rank | |
| 654 | 2,520 | Ventural | Mar 12, 2026 - 12:36 | 2.37 | 1.57MB | ZIP |  , out of 19 Votes. , out of 19 Votes. |
|
| File Tags | ||||||||
| system Venmon monitor ping tool Windows monitoring network monitor portable freeware | ||||||||
Click to Rate File Share it on Twitter → Tweet
|