|

|
Processed through Paypal No account required. |








Buy our over-priced crap to help pay the bills.



|
|
Processed through Paypal No account required. |
| Files | ||||
| File Name | Rating | Downloads | ||
 |
Agent DVR v7.9.2.0 Agent DVR v7.9.2.0 👉 A powerful, self-hosted video surveillance and monitoring platform. Agent DVR is a full-featured video surveillance application designed for local and remote monitoring of cameras and microphones. It supports a wide range of devices including IP cameras, USB webcams, and audio inputs, and provides advanced functionality such as motion detection, recording, alerts, and remote access through a web-based interface. Features: • Supports IP cameras, USB webcams, RTSP streams, and audio devices • Compatible with ONVIF devices for easy camera discovery and setup • Browser-based interface with no client software required • Remote access from anywhere via secure web portal • Motion detection with adjustable sensitivity, zones, and filters • AI object detection including people, vehicles, animals, and custom models • Facial recognition support (with configured AI services) • License plate recognition (via integrations) • Continuous, motion-triggered, and scheduled recording modes • Timeline-based playback with fast scrubbing and event markers • Multiple simultaneous camera streams with grid and custom layouts • PTZ control including presets, tours, and auto-tracking (supported cameras) • Audio recording, live listening, and two-way audio support • Alerts and notifications via email, SMS, push, webhook, and API triggers • Smart alerts based on AI detection events • Event logging with searchable history • User accounts with roles, permissions, and access restrictions • HTTPS support for secure connections • No port forwarding required using built-in remote access services • Local storage with configurable retention policies • Cloud upload support including FTP, SFTP, and third-party services • Automatic cleanup and disk management options • Multi-server support for distributed camera setups • Plugin system for extending functionality • Integration with home automation systems and external APIs • Support for hardware acceleration (GPU) to improve performance • Cross-platform support via .NET and Docker containers • Import/export configuration and backup settings • Supports multiple layouts, themes, and UI customization • Snapshot capture and image archiving • Privacy masking zones for sensitive areas • Time-lapse recording and export • Multi-language interface support (where available in ... |
 |
4,579 | Aug 19, 2026 iSpyConnect.com  |
|
AllThreadsView v1.00 AllThreadsView v1.00 👉 View all running Windows threads from every process in one table. AllThreadsView is a lightweight portable utility from NirSoft that displays every running thread from every active process on your Windows computer in a single, continuously updated list. Instead of examining one process at a time, you can instantly see detailed information for all system and application threads, making it much easier to troubleshoot performance problems, investigate application behavior, or inspect low-level process activity. Features: • Displays all running threads from every active process • Shows Thread ID, Process ID, Process Name and Process Path • Displays thread creation time, duration, kernel time and user time • Shows thread priority, base priority and wait reason • Displays the thread start address • Automatically refreshes the thread list • Option to display only active threads • Export selected or all items to TXT, CSV, HTML, XML and JSON • Portable application requiring no installation Supported operating systems: • Windows XP, Windows Vista, Windows 7, Windows 8, Windows 10 • Windows 11 • 32-bit and 64-bit editions Supported languages: English, Arabic, Basque, Bulgarian, Catalan, Czech, Danish, Dutch, Finnish, French, German, Greek, Hungarian, Italian, Japanese, Korean, Persian, Polish, Portuguese, Portuguese (Brazil), Romanian, Russian, Simplified Chinese, Slovak, Slovenian, Spanish, Swedish, Traditional Chinese, Turkish, Ukrainian Changes: v1.00 06-28-26 • First release. This download is for the Windows 64bit version (very bottom of page). If you need the Windows 32bit version, download here. Click here to visit the author's website. |
|
4,620 | Jun 29, 2026 Nir Sofer 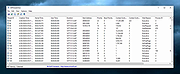 |
 |
AMD Ryzen Master v3.1.1.5502 AMD Ryzen Master v3.1.1.5502 👉 Unlock, monitor, and tune AMD Ryzen processor performance. AMD Ryzen Master is AMD's official utility for controlling and monitoring supported AMD Ryzen processors. It provides access to overclocking, system telemetry, automatic tuning, performance profiles, CPU and RAM views, integrated Radeon graphics tuning, PBO and Curve Optimizer settings, and real-time monitoring for clock rates, temperatures, and voltages. Features: • Official AMD utility for supported Ryzen processors • Redesigned interface for essential controls and telemetry • Basic and Advanced modes • Automatic CPU and RAM overclocking • Real-time per-core clock monitoring • Temperature and voltage monitoring • Average and peak readings • Custom monitoring views • Multiple performance profiles • Tune Ryzen CPU settings • Adjust integrated Radeon graphics frequency • Adjust DDR5 memory timings • Workspace for immediate tuning adjustments • Integrated Radeon graphics overclocking on supported processors • PBO and Curve Optimizer adjustment options • CPU CCD monitoring views • RAM views focused on EXPO parameters Supported operating systems: • Windows 10 64-bit, Windows 11 64-bit Supported languages: English, German, French, Simplified Chinese Changes: v3.1.1.5502 07-22-26 Release Highlights Added support for the Curve Shaper feature – a fine‑grain voltage/frequency tuning capability that allows selective voltage adjustments across temperature and frequency bands; applicable to the AMD Ryzen™ 9000 Series. Known Issues The application may take a bit longer to load on systems with higher core count CPUs In certain scenarios, when Ryzen Master is launched from AMD Software: Adrenalin Edition™, Ryzen Master Dashboard may not display accurate metric values. As a workaround, restart your system, and then launch Ryzen Master before starting AMD Software: Adrenalin Edition™. This download is for the Ryzen 5000 Series processors and later version (very bottom of page). All other download assets are below: For Ryzen 3000 Series to 4000 Series processors version: amd_ryzen_master_2.14.3.5040.exe For Ryzen 2000 Series processors and earlier version: amd-ryzen-master-2-13-1-3097.exe Click here to visit the author's website. |
|
24,014 | Sep 16, 2026 Advanced Micro Devices, Inc 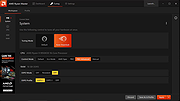 |
|
AOMEI Cyber Backup Free v4.5.0 AOMEI Cyber Backup Free v4.5.0 👉 Free centralized backup and disaster recovery solution for virtual machines, Windows systems, and SQL Server databases. AOMEI Cyber Backup Free is an enterprise-class backup and recovery platform that allows administrators to protect virtual machines, physical computers, servers, and databases from a single web-based management console. Designed for businesses, IT departments, MSPs, and home labs, it simplifies backup scheduling, monitoring, restoration, and storage management across multiple systems. The free edition provides a surprisingly comprehensive feature set for small environments. It supports up to 3 Hyper-V virtual machines, 3 VMware ESXi virtual machines, unlimited VMware Free ESXi virtual machines, 3 Microsoft SQL Server databases, 3 Windows PCs, and 1 Windows Server. Included at no cost are agentless VM backups, full, incremental, and differential backup methods, automated scheduling, Amazon S3 backup archiving, task monitoring, log management, role-based management, and point-in-time recovery. While some advanced enterprise capabilities require a paid license, the free edition delivers powerful centralized backup protection suitable for many small business and lab deployments. Features: • Centralized web-based backup management console • Protect up to 3 Hyper-V virtual machines • Protect up to 3 VMware ESXi virtual machines • Unlimited VMware Free ESXi virtual machine support • Protect up to 3 Microsoft SQL Server databases • Protect up to 3 Windows PCs • Protect 1 Windows Server • Agentless backup for VMware and Hyper-V virtual machines • Full backup support • Incremental backup support • Differential backup support • Automated backup scheduling and execution • Backup to local storage devices • Backup to network shares and NAS devices • Archive backups to Amazon S3 cloud storage • Flexible retention policy configuration • Restore entire virtual machines • Restore from any available backup point • Restore workloads to their original location • Backup task monitoring dashboard • Backup log management and reporting • Email notification support • Role-based management controls • Centralized monitoring of all protected workloads • Browser-based administration from any supported system • Free ... |
|
1,138 | Jun 12, 2026 AOMEI Technology Co., Ltd  |
|
AppControl v1.3.0.335b AppControl v1.3.0.335b 👉 Historical Task Manager with powerful application control, privacy monitoring, and system insights. AppControl is a free Windows system monitoring and application management utility developed by Jon Hundley and the AppControl team. Rather than only showing what your computer is doing right now, AppControl continuously records system activity for up to 72 hours, allowing you to review past CPU, GPU, memory, disk, temperature, and application activity to identify exactly what happened when your PC slowed down, overheated, or behaved unexpectedly. AppControl also extends far beyond the capabilities of the standard Windows Task Manager by providing detailed information about running processes, historical hardware usage, application launches, privacy events, and system activity. It can alert you when new or unsigned applications run, when software accesses your webcam, microphone, or location, and allows you to permanently disable unwanted applications or block entire publishers with custom rules. Built-in plain-language descriptions explain what Windows processes and executables actually do, making it easier to understand what's happening on your PC without searching the web Features: • Historical CPU, GPU, memory, disk, and temperature monitoring • Review up to 72 hours of recorded system activity • Timeline graphs with click-and-drag zoom • Monitor application launches, updates, and system events • Alerts for new, unusual, or unsigned applications • Privacy alerts for webcam, microphone, and location access • Permanently disable unwanted applications • Block entire software publishers • Plain-language descriptions of running processes and executables • Command-line monitoring tool for Windows Terminal, PowerShell, and Command Prompt • Automatic light and dark theme support • Custom notification options • Search and investigate running applications quickly Supported operating systems: • Windows 10 • Windows 11 Supported languages: English, German, Spanish, Japanese, French, Polish, Russian, Dutch, Serbian (Cyrillic), Italian, Turkish, Chinese Changes: v1.3.0.335b 05-14-26 Added range selection and zooming on timeline graphs. Added a command-line monitoring tool for Windows Terminal, PowerShell, and Command Prompt. Added an automatic theme that matches Windows light or dark mode. Added ... |
|
821 | Jun 27, 2026 Jon Hundley and Team 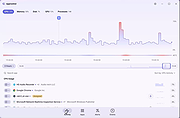 |
|
BATExpert v1.14.5.27 BATExpert v1.14.5.27 Monitor and evaluate the health of your laptop battery. BATExpert gives you a crystal-clear vision of your laptop battery health status right at your fingertips. Designed specifically for notebook and laptop computers, it displays important battery information in a simple interface and helps you monitor battery condition, usage, and performance. BATExpert decodes battery manufacturer information and provides real-time details about charge status, current power usage, battery chemistry, and other useful metrics. The program can also estimate the remaining time before a low-battery warning occurs and recommends a battery upgrade when appropriate. Features: • Clear laptop battery manufacturer data decoding • Displays current charge status • Shows current usage and charge rate • Displays battery type (chemistry) • Displays battery temperature when available • Estimates time remaining before low-level warning • User-friendly interface • Internationalization support • Battery upgrade recommendations when appropriate Supported operating systems: • Windows XP, Windows Vista, Windows 7, Windows 8, Windows 8.1, Windows 10, Windows 11 Supported languages: • English Changes: v1.14.5.27 04-23-23 • Updated ICS library to v8.70 • Updated OpenSSL to v3.1.0 • Added ReactOS detection in logs • Improved Windows Server 2003 detection Click here to visit the author's website. |
|
10,983 | Jun 05, 2026 KC Softwares 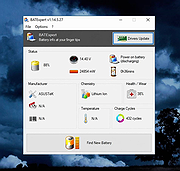 |
|
Clear Disk Info v4.4.1.0 Clear Disk Info v4.4.1.0 👉 Monitor hard drive and SSD health information with a clean and easy-to-read interface. Clear Disk Info is a lightweight disk monitoring utility designed to display detailed SMART information for hard drives and SSDs. It helps users keep track of drive health, temperature, firmware details, power-on hours, transfer modes, and other important storage statistics in a clear and organized layout. The program supports multiple storage device types and provides quick access to essential diagnostic information for detecting potential drive problems before data loss occurs. Features: • Displays SMART health and diagnostic information for HDDs and SSDs • Shows drive temperature, health status, firmware, and serial numbers • Supports SATA, NVMe, and USB-connected storage devices • Monitors power-on hours, drive usage, and transfer modes • Clean and lightweight user interface with easy-to-read statistics • Provides real-time drive condition monitoring • Supports multiple drives simultaneously • Portable and installer versions available • Designed for fast access to essential disk health data Supported operating systems: • Windows 7, Windows 8, Windows 10, Windows 11 Supported languages: English Changes: v4.4.1 08-02-25 Refreshed the UI with a more modern font. Bug fixes Click here to visit the author's website. |
|
11,612 | May 19, 2026 Carifred 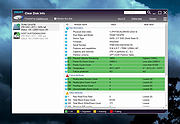 |
|
Core Temp v1.21 Core Temp v1.21 👉 Compact CPU monitoring utility for tracking processor temperatures, loads and other vital information. Core Temp is a small, lightweight processor monitoring utility designed to display the temperature of each individual CPU core in real time. It reads the Digital Thermal Sensors built into modern Intel, AMD and VIA x86 processors, providing accurate temperature information directly from the processor rather than relying on motherboard sensors. It can also display processor model information, frequencies, load levels, power-related data and minimum, maximum and average temperature readings. Core Temp offers customizable notification-area monitoring, logging, Mini-Mode and support for plug-ins that can extend its functionality. Features: • Monitors the temperature of individual CPU cores in real time • Reads temperatures directly from the processor's Digital Thermal Sensors • Supports Intel, AMD and VIA x86 processors • Displays processor identification and model information • Shows individual core load information • Displays processor frequency information • Tracks minimum, maximum and average temperature readings • Provides configurable notification-area sensor displays • Includes a battery status indicator for the notification area • Includes a compact Mini-Mode display • Adjustable user-interface zoom • Can log processor temperature and monitoring information • Supports multiple processors and multiple cores • Motherboard-independent temperature monitoring • Provides shared-memory data for other applications • Supports plug-ins and add-ons for expanded functionality • Lightweight design with a small system footprint Supported operating systems: • Windows XP, Windows 7, Windows 8, Windows 8.1, Windows 10, Windows 11 • Windows Server 2003, Windows Server 2008, Windows Server 2012, Windows Server 2016, Windows Server 2019, Windows Server 2022, Windows Server 2025 Supported languages: English, Abkhaz, Armenian, Bulgarian, Simplified Chinese, Traditional Chinese, Catalan, Czech, Danish, Dutch, Finnish, French, Galician, German, Greek, Hebrew, Hungarian, Italian, Japanese, Korean, Norwegian, Polish, Portuguese, Romanian, Russian, Slovak, Slovenian, Spanish, Swedish, Turkish, Ukrainian, Vietnamese Changes: v1.21 10-03-26 - New: Redesign the notification tray configuration dialog. Should now be more intuitive and flexible. - Fix: Notification tray icons issues; missing ... |
|
5,442 | Oct 14, 2026 Arthur Liberman 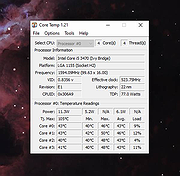 |
|
CPUSetter v1.7.1 CPUSetter v1.7.1 👉 Control CPU cores, hyperthreading, and process CPU usage on macOS. CPUSetter is a macOS utility that lets you control how your Mac's processor resources are used. It can enable or disable CPU cores and hyperthreading on supported processors, apply separate settings for battery and AC power, and limit the CPU usage of individual processes. CPUSetter also includes a process manager for adjusting process priority, viewing running applications, terminating processes, and monitoring system performance with built-in CPU, memory, disk, and network graphs. Administrator privileges are required for hardware-related changes, and a privileged helper tool is installed during first launch. Features: • Enable or disable physical and logical CPU cores • Enable or disable hyperthreading on supported processors • Apply separate CPU settings for battery and AC power • Limit the maximum CPU usage of individual processes • Change process priority (nice value) • Enable or disable throttling of low-priority processes • View and manage all running processes • Terminate running processes • Reveal process executables in Finder • Bring applications to the foreground • Display live CPU, memory, disk, and network performance graphs • Optionally apply saved settings automatically at system startup Supported operating systems: • macOS Big Sur 11.5 or higher Supported languages: English Changes: v1.7.1 12-16-25 • Requires macOS Big Sur (11.5) or later • Updated to Sparkle 2.7.0 • Fixed CPU sampling for hyperthreaded hosts In this screenshot, the Handbrake process has been limited to a maximum of 100% CPU usage (i.e. 1 whole core from the 4 available) and also reduced to a priority of 19. It is constrained as can be seen by it requesting more CPU resource than it is allowed to use. Click here to visit the author's website. |
|
3,537 | Jun 23, 2026 Bryan Christianson 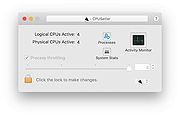 |
|
CrystalDiskInfo v9.9.3 CrystalDiskInfo v9.9.3 👉 Monitor and analyze the health and performance of your hard drives and SSDs. CrystalDiskInfo is a free hard drive health monitoring utility that provides detailed information about your storage devices, including HDDs, SSDs, and NVMe drives. It reads S.M.A.R.T. (Self-Monitoring, Analysis and Reporting Technology) data to help detect potential drive failures before they happen. CrystalDiskInfo displays temperature, health status, firmware version, serial number, interface, transfer mode, drive letters, and total host reads and writes for supported devices. It supports a wide range of storage interfaces and gives users a clear overview of drive condition through an easy-to-read interface with color-coded health indicators. CrystalDiskInfo is lightweight, easy to use, and ideal for anyone who wants to keep an eye on their system’s storage reliability and performance. Features: • Displays detailed S.M.A.R.T. information • Real-time drive temperature monitoring • Health status indicators with color coding • Supports HDD, SSD, and NVMe drives • Shows firmware, serial number, and interface details • Tracks total host reads and writes • Alert notifications for critical drive conditions • Lightweight and easy-to-use interface Supported operating systems: • Windows XP, Windows Vista, Windows 7, Windows 8, Windows 10, Windows 11 Supported languages: Abkhazian, Arabic, Armenian, Azerbaijani, Bulgarian, Catalan, Croatian, Czech, Danish, Dutch, English, Filipino, Finnish, French, Galician, German, Greek, Hebrew, Hungarian, Italian, Japanese, Korean, Lithuanian, Norwegian, Persian, Polish, Portuguese (Brazil), Portuguese (Portugal), Romanian, Russian, Serbian, Simplified Chinese, Slovak, Slovenian, Spanish, Swedish, Thai, Traditional Chinese, Turkish, Ukrainian, Vietnamese Changes: v9.9.3 10-11-26 Fixed: Transfer Mode Display for JMicron External Controllers Improved: SanDisk SSD SSD support Updated: Language files (Traditional Chinese) Click here to visit the author's website. |
|
10,666 | Oct 12, 2026 hiyohiyo  |
|
Delta v0.1.8 Delta v0.1.8 👉 Disk space analyzer with historical snapshot comparison. Delta is a disk space analysis tool that allows you to scan your drives, save storage snapshots, and compare changes over time. It helps you quickly identify which folders and files have grown or shrunk between scans. Designed to work fully offline, Delta stores scan data locally and focuses on lightweight performance with a modern user interface. Features: • Scan drives and analyze folder and file size usage • Save disk usage snapshots for historical tracking • Compare past and current scans to detect size changes • Fully offline operation with no telemetry • Lightweight application built with Rust and Tauri • Modern interface powered by React Supported operating systems: • Windows 10, Windows 11, Linux Supported languages: English Changes: v0.1.8 05-31-26 • Bug fixes • Added sorting improvements • UI changes Note: This file has one hit on VirusTotal. We have confirmed this to be a false positive. The file is safe. This download is for the Windows 64bit setup version (very bottom of page). All other download assets are below: Other Windows: delta_0.1.8_x64_en-US.msi Linux: delta-disk-analyzer_0.1.8_amd64.deb delta-disk-analyzer-0.1.8-1.x86_64.rpm delta-disk-analyzer_0.1.8_amd64.AppImage Click here to visit the author's website. |
|
798 | Jul 11, 2026 Austin Bian  |
|
Drive Speedometer 1.1.0 Drive Speedometer 1.1.0 Drive Speedometer is a program I made to help monitor the current read and writes speeds of your hard drives. Benefits include: When your system is running slow yet your CPU usage and memory usage are fine, it is normally the hard drive being maxed out. Now you will be able to keep an eye on the hard drive performance. When a drive is slowly dying it will run slower and slower. Being aware of what your normal drive speeds are and seeing those speed drop over time is a great indicator it is time to replace the drive. Being a performance nut myself I like knowing what my system is doing. When I have a program doing some work and appears to be hung up I can see if it is still reading or writing to the drive. This way I know the program isn't hung up and is still working. The program uses the Windows performance counters to pull the information. If you have disabled your performance counters I have included a reg file in the setup to enable them again. Run the reg file and reboot. Your performance counters will be working again. I have also included some pre made bar fill graphics. Including some to use when running the monitor in compact mode. You can of course make your own as well. |
 |
10,088 | Jan 08, 2013 PcWinTech |
|
Fan Control v275 Fan Control v275 👉 Highly customizable fan control software for Windows. Fan Control is a focused and highly customizable fan controlling software for Windows that lets you control CPU, GPU, and case fans using temperature-based logic. It supports guided setup, multiple profiles, theme customization, multiple temperature sources, several fan curve functions including custom graphs, mixed fan curves and sensors using max, min, or average logic, low resource usage, and advanced tuning options such as steps, start and stop percentages, response time, and hysteresis. Features: • Guided setup process on first launch • Save, edit, and load multiple profiles • Change the theme and color of the application • Multiple temperature sources including CPU, GPU, motherboard, and hard drives • Multiple fan curve functions, including a custom graph • Mix fan curves or sensors together using max, min, or average • Low resource usage • Advanced tuning with steps, start %, stop %, response time, and hysteresis • Extensive support for CPU, GPU, case fans, and other hardware such as AIOs • Plugin support for adding third-party temperature, speed, or control sensors Fan curve types • Auto: PI-ish type function. % will surf until temp is stable at load. • Linear : Temperature based linear function • Graph : Temperature based custom curve • Target: Temperature based that holds speed until target temperature is reached • Mix : Use two different curves and apply a mix function (Min, Max, Sum, Average) • Sync : Sync to an existing control • Flat: Set a fixed % Graph fan curve editor • Change the temperature range for finer control ... |
|
7,181 | Aug 26, 2026 Rem0o 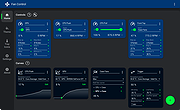 |
|
Feex v0.19.12 Feex v0.19.12 👉 A free Windows utility for monitoring, diagnosing, understanding and maintaining your PC. Feex is a free Windows system utility that combines PC monitoring, diagnostics and maintenance tools in a single application. It provides real-time information about CPU, GPU, memory, disks and other system activity while helping identify applications and processes that may be consuming excessive resources. Feex goes beyond basic system monitoring by keeping useful historical information about your computer. It can analyze startup programs, monitor boot speed over time and help identify common Windows problems and changes that may be affecting performance. Detailed hardware and system information is available to help you understand the components and configuration of your PC. Built-in maintenance tools can help clean caches and unnecessary files, locate duplicate files and perform Windows maintenance and performance tasks. When Feex proposes meaningful changes to the system, it explains what will be affected and asks for approval before proceeding. Privacy is an important part of Feex's design. System understanding and history are stored locally on the PC, and the program can continue operating without an Internet connection. File discovery uses metadata such as filenames, types, sizes and dates rather than reading the contents of documents, emails or chats. Feex does not collect passwords or browsing history, capture the screen, log keystrokes, record audio or video, or inspect the contents of network traffic. It is not intended to replace antivirus software and can be used alongside Windows Defender or other security software. Features: • Monitors CPU, GPU, RAM, disk and overall system activity • Identifies resource-heavy applications and processes • Analyzes programs configured to run at startup • Monitors boot speed and maintains boot history • Provides detailed hardware and system information • Detects common Windows issues • Cleans caches and unnecessary files • Detects duplicate files • Provides Windows maintenance and performance tools • Keeps historical information about system behavior • ... |
|
392 | Sep 04, 2026 Feex 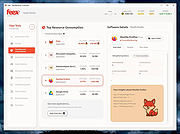 |
|
FurMark 1 v1.39.3.0 FurMark 1 v1.39.3.0 Advanced GPU stress testing and graphics benchmarking utility. FurMark 1 is a powerful OpenGL-based GPU stress testing and benchmarking application designed to push graphics cards to their thermal and performance limits. Commonly used by enthusiasts, overclockers, and technicians, FurMark helps evaluate graphics card stability, cooling efficiency, and overall performance under extreme load conditions. FurMark 1 uses an intensive fur rendering engine that heavily loads the GPU, making it useful for detecting overheating issues, cooling problems, instability, graphical artifacts, or power delivery limitations. The application also provides benchmarking modes, fullscreen and windowed testing, custom resolutions, anti-aliasing options, frame rate monitoring, and GPU temperature tracking. FurMark 1 includes support for GPU monitoring utilities such as GPU-Z and GPU Shark, preset benchmark profiles, screenshot capture, and multi-GPU configurations. It is frequently used to validate graphics card stability after driver updates, hardware upgrades, or overclocking adjustments. Features: • Intensive GPU stress testing and burn-in benchmarking • OpenGL-based rendering engine • Real-time GPU temperature monitoring • Fullscreen and windowed benchmark modes • Custom resolutions and anti-aliasing support • GPU stability and overheating detection • Preset benchmark profiles • Multi-GPU support • FPS monitoring and performance statistics • Screenshot capture support • GPU information support through GPU-Z and GPU Shark • Portable and installer versions available • Useful for overclock stability testing and thermal validation Supported operating systems: • Windows 7, Windows 8, Windows 10, Windows 11 Supported languages: • English Changes: v1.39.3.0 10-08-25 + added support of AMD Radeon RX 7700, Radeon RX 7400 and Radeon PRO W7400. + added support of NVIDIA GeForce RTX 5050, RTX PRO 5000 and RTX 5090 D v2. + added support of AMD Radeon RX 9060 XT, Radeon RX 9060, Radeon RX 9070 GRE, Radeon AI PRO R9700. + added logos in benchmark score box for Qualcomm and Moore Threads. ! updated: GPU Shark 0.33.3.0. ! updated: GPU-Z 2.68.0 ! updated: ZoomGPU 1.43.0 (32-bit GPU monitoring library) Click here ... |
|
8,305 | Jun 05, 2026 Geeks3D  |
|
FurMark 2 v2.10.2 FurMark 2 v2.10.2 OpenGL and Vulkan GPU stress test and graphics benchmark. FurMark 2 is the next-generation edition of the legendary GPU stress testing and benchmarking utility from Geeks3D. Designed for gamers, overclockers, system builders and hardware enthusiasts, FurMark 2 pushes graphics cards to their thermal and performance limits using demanding OpenGL and Vulkan rendering workloads. It is commonly used to test cooling performance, verify GPU stability, identify overheating issues, detect graphical artifacts, and benchmark overall graphics performance. Unlike the original FurMark 1, FurMark 2 introduces a redesigned engine with modern rendering technologies, Vulkan support, improved compatibility with current GPUs, and enhanced benchmarking capabilities. The software can run intensive fullscreen or windowed stress tests while displaying real-time GPU information including temperatures, clocks, usage, fan speeds, and performance statistics. FurMark 2 also includes benchmark presets for quick comparisons, customizable testing modes, anti-aliasing options, artifact scanning, and command-line support for automation and advanced diagnostics. Whether you are validating a fresh GPU installation, testing overclock stability, troubleshooting crashes, or simply comparing benchmark scores with other systems online, FurMark 2 provides a fast and reliable solution for GPU performance analysis. Features: • Advanced OpenGL and Vulkan GPU stress testing • Designed to heavily load GPUs for thermal and stability testing • Modern rendering engine optimized for current graphics hardware • Built-in benchmark presets for quick performance comparisons • Custom benchmark modes with adjustable resolution and anti-aliasing • Real-time GPU monitoring during testing sessions • Displays GPU temperature, clocks, fan speed, usage and performance data • Artifact scanner helps detect rendering errors and unstable overclocks • Supports fullscreen and windowed testing modes • Online benchmark score submission and comparison support • Useful for validating overclocking and cooling system performance • Command-line options for scripting and automated testing • Compatible with many NVIDIA, AMD and Intel graphics cards • Includes GPU information and hardware identification tools • Lightweight interface with quick access to common ... |
|
2,154 | Jun 05, 2026 Geeks3D 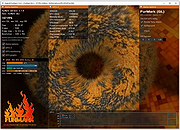 |
|
GSmartControl v2.0.2 GSmartControl v2.0.2 👉 Hard disk and SSD health inspection tool using S.M.A.R.T. data. GSmartControl is a graphical user interface for smartctl (from smartmontools) that allows you to inspect the S.M.A.R.T. data of hard disk drives and solid-state drives to determine their health status. It supports ATA and SCSI devices and provides detailed drive information, attributes, error logs, and self-test results. GSmartControl enables you to run various self-tests, including short, extended, and conveyance tests, and displays the results in an easy-to-read format. It also provides drive identification information, capabilities, and statistics to help diagnose potential hardware issues before failure occurs. Features: • View detailed S.M.A.R.T. attributes and drive information • Perform short, extended, and conveyance self-tests • Automatic detection of ATA and SCSI devices • Display error logs and self-test logs • Advanced drive information and capability reporting • Cross-platform support Supported operating systems: • Windows 7, Windows 8, Windows 10, Windows 11 • macOS • Linux Supported languages: English Changes: v2.0.2 02-24-25 Support GCC 11 (and Ubuntu 22.04) by using and vendoring fmt library (#77). Support an option of saving smartctl output to text instead of JSON (#76). Restored pre-2.0.0 runtime support for smartctl < 7.3 (based on Text parser); this is an unsupported, old method without NVMe, provided for compatibility only (#77). Restored pre-2.0.0 support for standard (non-extended) self-test log found in very old ATA drives; the new JSON parser did not support this previously (#79). Better support for temperature values in JSON parser; this fixes unreasonably large temperature values (#78). Add a tooltip explaining self-test "lifetime hours" wrapping behavior (#73). Windows: Fixed a crash on Windows 7 when opening drive information by using Windows 7-compatible librsvg (#71). Windows: Avoid using non-integer font sizes. This download is for the Windows 64bit portable ... |
|
6,592 | Jun 29, 2026 Alexander Shaduri 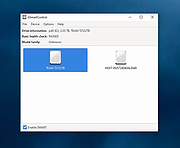 |
|
HWiNFO v8.54 HWiNFO v8.54 👉 Professional hardware information, real-time monitoring, and diagnostics for Windows and DOS systems. HWiNFO is a comprehensive hardware analysis, system information, diagnostics, and real-time monitoring utility designed for enthusiasts, technicians, and IT professionals. It provides detailed information about virtually every hardware component in your computer while continuously monitoring temperatures, voltages, fan speeds, power usage, clocks, storage health, and many other sensor values. HWiNFO also generates comprehensive hardware reports, supports extensive logging, and integrates with numerous third-party monitoring applications through its shared memory interface. Features: • In-depth hardware information with detailed analysis of system components • Real-time monitoring of CPUs, GPUs, mainboards, drives, and peripherals • System health monitoring designed to help detect overheating, overload, performance loss, or possible failure • Extensive reporting with full hardware hierarchy or quick summary overview • Export reports in XML, CSV, and HTML formats • Customizable monitoring tables, graphs, tray icons, and OSD • Customizable alerts on monitored parameters with user-defined actions • Support for interfacing with other applications and third-party extensions • Shared Memory interface support for exposing sensor data • Clean and secure design with no personal data collection and no network transmission • Frequently updated to support new hardware, technologies, and standards Supported operating systems: • Windows 95 and later (x86, x64 or ARM64) Supported languages: English, French, German, Spanish, Portuguese (Brazil), Italian, Dutch, Danish, Chinese (Simplified), Chinese (Traditional), Japanese, Korean, Vietnamese, Arabic, Russian, Ukrainian, Czech, Slovak, Hungarian, Polish, Swedish, Finnish, Norwegian, Greek, Turkish, Latvian, Hebrew Changes: v8.54 09-30-26 Added reporting of monitored process name to RTSS sensor title. Added workaround for NVML crash during GPU driver update. Fixed NZXT Kraken Elite V2 support. Fixed reporting of negative temperatures for NVIDIA GPU memory chips. Added ability to show multiple values on one line in OSD. Fixed reporting of PCH power on Intel Panther Lake and later. Added reporting of Fan Duty for Thermal Grizzly WireView Pro II. Added options to insert notes into json sensor log. Improved ... |
|
13,445 | Oct 02, 2026 REALiX 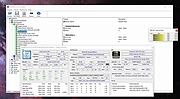 |
|
HWMonitor v1.68 HWMonitor v1.68 👉 Hardware monitoring tool that displays real-time system sensor data. HWMonitor is a hardware monitoring program that reads PC system health sensors to display voltages, temperatures, fan speeds, and power consumption in real time. It provides a clear and organized view of key hardware metrics gathered from onboard sensors, helping users monitor system stability and performance. HWMonitor supports a wide range of hardware including CPUs, GPUs, motherboards, and storage devices. It can read data from SMART-enabled hard drives, temperature sensors, and voltage rails, making it useful for diagnosing overheating issues or checking system performance under load. The interface is simple and lightweight, showing minimum, maximum, and current values for each sensor, allowing users to track changes over time without unnecessary clutter. Features: • Monitors temperatures, voltages, fan speeds, and power usage • Displays minimum, maximum, and current sensor values • Supports CPUs, GPUs, hard drives, and motherboards • Reads SMART data from storage devices • Lightweight and portable-friendly operation • Simple, easy-to-read interface Supported operating systems: • Windows XP, Windows Vista, Windows 7, Windows 8, Windows 10, Windows 11 Supported languages: English Changes: v1.68 09-14-26 PCI Express errors counters on AMD and Intel GPUs. New metrics on AMD Strix Point, Strix Halo and Kraken Point : NPU power, NPU clocks, NPU TOPS and TOPS per watt, NPU DRAM bandwidth usage, global platform power and DRAM read and write bandwidths. New HDD metrics (IOPS, average latency, NVMe controller link speed). Remembers devices & sensor types nodes state. This download is for the Windows x86/x64 version (very bottom of page). All other download assets are below: Other Windows: hwmonitor-arm64_1.05.zip Click here to visit the author's website. |
|
7,738 | Sep 16, 2026 CPUID 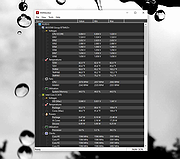 |
|
Kudu v3.6.1 Kudu v3.6.1 👉 Free open-source system maintenance, optimization, and security suite for Windows, macOS, and Linux. Kudu is a comprehensive system maintenance toolkit designed to help users clean, optimize, monitor, and secure their computers from a single unified interface. Built as a free and open-source alternative to many commercial system utilities, it combines system cleaning, malware detection, startup management, privacy protection, software updating, disk analysis, and performance monitoring tools into one package. Kudu focuses on providing powerful maintenance capabilities without advertisements, bundled software, or subscription requirements. It is suitable for both home users and IT professionals who want to keep systems running efficiently while maintaining privacy and security. Kudu also includes automation features, real-time monitoring, gaming optimizations, and optional cloud-based fleet management (paid) capabilities for managing multiple devices. Features: • System Cleaner for removing temporary files, caches, logs, and system junk • Multi-engine malware scanner with signature-based threat detection • Real-time performance monitoring for CPU, memory, disk, and network activity • S.M.A.R.T. disk health monitoring and analysis • Startup Manager with impact ratings for startup entries • Interactive Disk Analyzer with visual storage usage mapping • Privacy Shield for auditing and applying privacy settings • Software Updater for detecting outdated applications • Debloater for removing unwanted pre-installed Windows applications • Registry Cleaner with automatic backup protection • One-click Game Mode with performance and latency optimizations • Scheduled maintenance, scanning, and update tasks • Automatic backup safeguards before system changes • Command-line support for automation and scripting • Optional cloud-based centralized device management • Open-source MIT-licensed project with no advertisements or bundled software Supported operating systems: • Windows 10, Windows 11 • macOS • Linux Supported languages: • 30 languages supported Changes: v3.6.1 10-06-26 Bug Fixes icons: add missing Windows DPI sizes to the app icon (#513) (920f59c) malware: stop flagging validly signed binaries with the PE heuristic (#507) (e9784a1) 👉 This download is for the Windows version (very bottom of page). All ... |
|
661 | Oct 07, 2026 Advent Development, Inc. 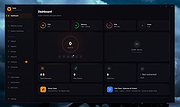 |
|
Network Spy Monitoring Software 1.0 Network Spy Monitoring Software 1.0 IMPORTANT: The zip file will ask you to enter a password. Just leave it blank. Network Spy Monitoring Software main use is to Monitor Network activities on authorized LAN Networks in real-time with a very fast ping scan. rogram Features: 1. Fast Ping Scan! 2. No PayPal Donations SPAM! 3. Easy To Use 4. 100% FREEWARE 5. 100% Spyware Free 6. Compatible With Windows 8 7. Very Lightweight 8. User Elevation 9. Newer Interface 10. Background Scan 11. Open Computer via Explorer etc. 12. VNC Remote Desktop Monitoring 13. User Interface Update - New Feature! |
|
7,696 | Oct 11, 2016 Blackbox HACKER 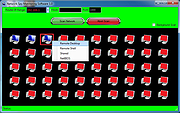 |
|
NetworkConnectLog v1.18 NetworkConnectLog v1.18 👉 Monitor and log devices connecting to and disconnecting from your local network. NetworkConnectLog is a lightweight, portable network monitoring utility that continuously scans your local area network using ARP and NetBIOS protocols, recording every device that connects to or disconnects from your network. It is ideal for home users, technicians, and network administrators who want to keep track of network activity, identify unknown devices, or troubleshoot intermittent connection issues. The program immediately performs an initial scan to detect all currently connected devices, then continues monitoring in the background for connection and disconnection events. Each log entry includes useful information such as the event time, IP address, computer name, workgroup, MAC address, and network adapter manufacturer. Logs can be searched, sorted, filtered, and exported to several common formats for documentation or further analysis. Features: • Portable application requiring no installation • Automatically detects computers and devices joining or leaving your network • Uses ARP and NetBIOS protocols for device detection • Displays connection and disconnection timestamps • Shows IP address, computer name, workgroup, MAC address, and network adapter manufacturer • Performs continuous background monitoring • Configurable network adapter and IP address scanning range • Adjustable scan interval • Automatically export logs whenever changes are detected • Export logs to TXT, CSV, HTML, XML, or tab-delimited files • Search and sort recorded events • Customizable font and MAC address display format • System tray support • Optional always-on-top mode • Optional black background display mode • High DPI display support Supported operating systems: • Windows 2000, Windows XP, Windows Vista, Windows 7, Windows 8, Windows 8.1, Windows 10, Windows 11 (32-bit and 64-bit) Supported languages: • English, Arabic, Brazilian Portuguese, Dutch, French, German, Greek, Hungarian, Italian, Japanese, Persian, Polish, Romanian, Russian, Simplified Chinese, Slovak, Spanish, Traditional Chinese, Turkish, Valencian Changes: v1.18 07-01-26 Updated the internal MAC addresses database. Click here to visit the author's website. |
|
7,266 | Jul 03, 2026 Nir Sofer 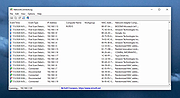 |
|
Novabench v6.0.3 Novabench v6.0.3 👉 Free PC benchmarking and hardware performance testing utility. Novabench is a free benchmarking program that allows you to quickly test and evaluate your computer’s overall performance. It measures CPU, GPU, RAM, and storage speeds using a simple interface designed for both casual users and technicians. The free version provides a complete system benchmark score along with detailed hardware information and comparison tools to help identify performance bottlenecks or hardware problems. Novabench can be useful for checking system stability after upgrades, comparing hardware performance against similar systems, troubleshooting slow computers, and monitoring the effects of overclocking or driver updates. Benchmark results can also be uploaded online to compare your PC with other systems using the Novabench database. Features: • Free CPU, GPU, RAM, and disk benchmarking • Generates an overall system performance score • Quick benchmark testing with minimal setup required • Displays detailed hardware and system information • Compare benchmark results with other systems online • Useful for testing gaming PCs, laptops, and workstations • Helps identify hardware bottlenecks and slow components • Portable benchmark results that can be shared online • Lightweight interface suitable for beginners and technicians • Supports stress testing and stability verification tools • Includes temperature and hardware monitoring support • Can help verify system improvements after upgrades or repairs Supported operating systems: • Windows 10, Windows 11 • macOS 11 Big Sur or higher • Linux distributions supporting modern x86-64 hardware Supported languages: • English Changes: v6.0.3 06-09-26 • Improved benchmark reliability and scoring consistency • Updated hardware detection and compatibility support • General bug fixes and stability improvements This download is for the Windows installer version (very bottom of page). All other download assets are below: Other Windows: novabench-arm64.exe macOS: novabench.dmg Linux: novabench-x64.deb novabench-arm64.deb novabench-x64.rpm novabench-arm64.rpm Click here to visit the author's website. |
|
7,802 | Jun 09, 2026 Novawave Inc. 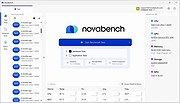 |
|
O&O DeskInfo v2.0.1033 O&O DeskInfo v2.0.1033 👉 Portable desktop system monitor that displays real-time hardware and network information directly on your desktop. O&O DeskInfo displays essential system information such as CPU usage, memory consumption, drive activity, network connections, battery status, and more directly on the Windows desktop in real time. The portable freeware utility allows users to monitor system activity without opening additional tools or menus. It also supports customizable layouts, colors, transparency, fonts, and multi-monitor positioning. O&O DeskInfo can quickly copy system details to the clipboard for troubleshooting and support purposes and includes warnings for unknown USB device connections. Features: • Real-time display of CPU, memory, drive, and network activity • Portable application with no installation required • Customizable desktop display position, colors, fonts, and transparency • Performance charts for CPU, memory, and network monitoring • Battery status display support for compatible systems • Detection of virtual machines • Profile editor with customizable columns and sortable categories • Clear distinction between local, removable, and network drives • Clipboard export for quick support and troubleshooting • Multi-monitor support • Warning notifications for unknown USB device connections • Adjustable update speeds and display modes • Tray icon integration with quick access functions • Automatic startup option with Windows Supported operating systems: • Windows 10 • Windows 11 Supported languages: • English, German, French Changes: v2.0.1033 01-28-26 • NEW: New performance charts for CPU, memory and network • NEW: Battery status display, if supported by the system • NEW: Detection of virtual machines • NEW: Greater flexibility in the profile editor with freely selectable columns and re-sortable categories • NEW: Improved customization options for the size of performance charts • NEW: Unified controls for a more consistent and clearer user interface • NEW: Extended documentation • NEW: Clearer distinction between local, removable and network drives • CHANGED: Performance charts react faster and more smoothly to display setting changes • CHANGED: Charts make better use of available space and appear overall clearer • CHANGED: Reduced visual duplication for a calmer display • ... |
|
3,673 | May 24, 2026 O&O Software GmbH 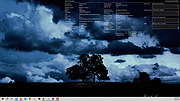 |
|
OpenNetMeter v0.14.3 OpenNetMeter v0.14.3 👉 Open-source Windows network data usage and monitoring tool. OpenNetMeter is an open-source Windows network monitoring application designed to help users track their real-time network speeds and overall data usage. The tool presents upload and download statistics, session and cumulative totals, and detailed breakdowns by process, all through an intuitive interface. The app includes additional monitoring features like a floating mini widget and historical usage logging. Features: • Real-time upload and download speed monitoring • Per-process network usage breakdown • Session and cumulative data tracking • Always-on-top mini widget window with pinning support • Up to 3-month history of data usage with date range selection • Dark mode for low-light use • No ads and lightweight • Open-source under Apache-2.0 license Supported operating systems: • Windows 10, Windows 11 (64-bit recommended) Supported languages: English Changes: v0.14.3 02-18-26 Added Added an upgrade detection dialog to better handle upgrade scenarios. Added an installer custom action to close a running app instance during uninstall. Changed Updated the desktop shortcut component GUID. Removed unused event log installer components. Fixed Fixed MSI upgrade behavior that could remove saved user files. Click here to visit the project's GitHub repository. |
|
819 | Jun 11, 2026 Ashfaaq Riphque 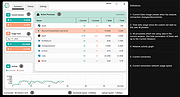 |
|
Portmaster Free v2.2.1 Portmaster Free v2.2.1 👉 Take complete control of your computer's network traffic and protect your privacy. Portmaster Free is a powerful open-source application firewall and privacy manager that lets you see, understand, and control every network connection made by your computer. Instead of simply allowing or blocking Internet access, Portmaster provides detailed visibility into which applications are communicating, where they are connecting, and what protocols they are using. Designed with privacy in mind, Portmaster automatically blocks many trackers, advertisements, malware hosts, and unwanted telemetry across your entire system rather than just within your web browser. It also secures DNS requests, provides extensive per-application and global network controls, and gives advanced users the flexibility to create highly customized filtering rules. Unlike traditional firewalls that focus mainly on inbound threats, Portmaster concentrates on outbound traffic, helping you identify applications that quietly phone home, collect telemetry, or communicate with unexpected servers. Whether you're a privacy enthusiast, security researcher, or simply want more insight into your computer's network activity, Portmaster offers one of the most comprehensive free solutions available. The free edition includes all core privacy and firewall functionality. Premium Safing features such as SPN (Safing Privacy Network), investigative tools, and priority support are optional and not required to use Portmaster's primary firewall and privacy capabilities. Features: • Monitor every incoming and outgoing network connection • Interactive application firewall with per-app network permissions • System-wide blocking of ads, trackers, and malware domains • Secure DNS requests using encrypted DNS-over-TLS • Create global and application-specific firewall rules • Block individual domains, IP addresses, countries, or connection types • Restrict peer-to-peer traffic to selected applications • View detailed connection history and network statistics • Control Internet access with simple allow and block rules • Automatic filter list updates for improved protection • Open-source software with publicly available source code • Automatic background updates for intelligence data and components Supported operating systems: • Windows 10 (64-bit), ... |
|
3,444 | Aug 04, 2026 Safing ICS Technologies GmbH 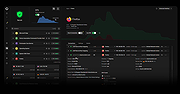 |
|
ProcessTCPSummary v1.25 ProcessTCPSummary v1.25 👉 Displays a detailed summary of TCP connections and listening UDP ports for every running Windows process. ProcessTCPSummary is a small portable network monitoring utility from NirSoft that displays a summary of processes that currently have TCP connections or listening UDP ports. For each process, it shows the total number of TCP connections, connection counts broken down by status such as Established, Listening, SYN-Sent and SYN-Received, IPv4 and IPv6 connection counts, commonly used port numbers and other connection details. When run as Administrator, it can also display TCP/UDP bytes sent and received by each process along with current sending and receiving speeds. The program requires no installation or additional DLL files. Simply extract the downloaded archive and run ProcessTCPSummary.exe. Information can also be exported from the command line to text, tab-delimited, CSV, JSON, HTML or XML files. Features: • Displays all processes with active TCP connections or listening UDP ports • Shows the total number of TCP connections for each process • Breaks TCP connections down by status, including Established, Listening, SYN-Sent and SYN-Received • Shows separate IPv4 and IPv6 TCP connection counts • Displays commonly used port numbers for each process • Shows TCP and UDP bytes sent and received when run as Administrator • Displays current network send and receive speeds • Can display the full paths of system processes when run as Administrator • Supports sorting by individual or multiple columns • Can save results as text, tab-delimited, CSV, JSON, HTML or XML files • Includes command-line options for unattended exporting and sorting • Supports a configurable system tray icon and Always On Top mode • Can start hidden when used with the tray icon option • Includes a black-background display option • Portable and requires no installation or additional DLL files Supported operating systems: • Windows XP, Windows Vista, Windows 7, Windows 8, Windows 8.1, Windows 10, Windows 11 • 32-bit and 64-bit Windows supported Supported ... |
|
6,226 | Sep 04, 2026 Nir Sofer 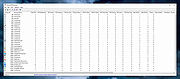 |
|
S.M.A.R.T. Monitoring Tools v7.3 S.M.A.R.T. Monitoring Tools v7.3 Disk Inspection and Monitoring The smartmontools package contains two utility programs (smartctl and smartd) to control and monitor storage systems using the Self-Monitoring, Analysis and Reporting Technology System (SMART) built into most modern ATA/SATA, SCSI/SAS and NVMe disks. In many cases, these utilities will provide advanced warning of disk degradation and failure. Smartmontools was originally derived from the Linux smartsuite package and actually supports ATA/SATA, SCSI/SAS and NVMe disks and also SCSI/SAS tape devices. It should run on any modern Linux, FreeBSD, NetBSD, OpenBSD, Darwin (macOS), Solaris, Windows, Cygwin, OS/2, eComStation or QNX system. Features • Schedule S.M.A.R.T. testing of your drive on a regular base with smartd • smartd prints log messages and triggers alert mails when a failure of your drive is predictable This download is for the Windows version. If you need the MacOS version, download here. If you need the Linux version, download here. Click here to visit the author's website. |
|
3,460 | Nov 30, 2022 Smartmontools devs 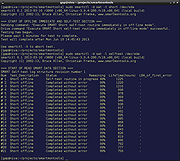 |
|
Simple Internet Meter 2.3.0 ==Official Mirror== Simple Internet Meter 2.3.0 Simple Internet Meter is my new bandwidth monitor. After my program CS Fire Monitor came out years ago I had many requests for added features. Many of those features where not possible to add using the Windows API. Such as seeing what is internet traffic and what is local network traffic. The only way to accomplish this is to look at the packet data. So I made this program using WinPcap and PacketX.dll. Limitations: 14-day trial To view the Help & FAQ for Simple Internet Meter - http://www.pcwintech.com/simple-internet-meter-help To view a video on the features and information on Simple Internet Meter - http://www.pcwintech.com/files/simple_internet_meter_video/index.htm Lite and standard features include: Monitor Network Traffic. Monitor a range of ports Keep logs of Daily & Hourly Usage Auto save any report to a file. Easily change the colors to fit your style and taste. Resize the monitors to make then very small and transparent, keeping them out of the way Blend to desktop mode makes the monitors blend to your desktop. Ghost mode makes the monitors click through. System tray icon can be animated to show network traffic. Open network connections and Windows firewall settings from the right click menu of the tray icon. (This makes getting to these areas much easier in Vista and Windows 7) Repair and view Network Information from the right click menu. View Detailed Netstats, showing what ports are being used and by what program. Extra Stats Features available only in the standard version: Remote View (Monitor Multiple Computers from any where in the world) Bandwidth Quotas Quota Alerts Determine what is Internet & Local Traffic Changelog: Major code updates and tweaks. Better handling when system comes out of sleep. |
|
9,953 | Dec 21, 2013 PcWinTech |
|
Simple Internet Meter Lite 2.3.0 ==Official Mirror== Simple Internet Meter Lite 2.3.0 Simple Internet Meter is my new bandwidth monitor. After my program CS Fire Monitor came out years ago I had many requests for added features. Many of those features where not possible to add using the Windows API. Such as seeing what is internet traffic and what is local network traffic. The only way to accomplish this is to look at the packet data. So I made this program using WinPcap and PacketX.dll. Lite and standard features include: Monitor Network Traffic. Monitor a range of ports Keep logs of Daily & Hourly Usage Auto save any report to a file. Easily change the colors to fit your style and taste. Resize the monitors to make then very small and transparent, keeping them out of the way Blend to desktop mode makes the monitors blend to your desktop. Ghost mode makes the monitors click through. System tray icon can be animated to show network traffic. Open network connections and Windows firewall settings from the right click menu of the tray icon. (This makes getting to these areas much easier in Vista and Windows 7) Repair and view Network Information from the right click menu. View Detailed Netstats, showing what ports are being used and by what program. Extra Stats Features available only in the standard version: Remote View (Monitor Multiple Computers from any where in the world) Bandwidth Quotas Quota Alerts Determine what is Internet & Local Traffic Changelog: Major code updates and tweaks. Better handling when system comes out of sleep. |
|
10,034 | Dec 21, 2013 PcWinTech |
|
SIV (System Information Viewer) v5.88 SIV (System Information Viewer) v5.88 👉 Detailed Windows system, hardware, sensor, and network information utility. SIV (System Information Viewer) is a general Windows utility for displaying extensive system information, including CPU, PCI, PCMCIA, USB, SMBus, SPD, ACPI, machine, hardware sensor, network, and operating system details. It can also control certain AIO devices such as fans and LEDs by using the appropriate command-line option Features: • Displays detailed CPU information including processor type, features, clock speeds, and topology. • Reports motherboard, chipset, BIOS information, and firmware details. • Shows comprehensive PCI, PCIe, EISA, and PCMCIA device information. • Provides SMBus and SPD data including memory module information and sensor readings. • Displays detailed hardware sensor information including temperatures, voltages, and fan speeds. • Reports GPU information including PCIe link speed and lane configuration. • Shows USB device information and connected hardware details. • Displays ACPI information and power management related system data. • Provides detailed operating system information including installed updates and system configuration. • Shows network adapter information, IP configuration, and network statistics. • Supports viewing hardware I/O ports and device resource allocations. • Includes tools to view ghost devices and hidden hardware entries in the system. • Can generate and save detailed system reports for diagnostics or troubleshooting. • Allows optional control of supported AIO devices such as fans and LEDs via command-line options. • Designed to work across both modern and legacy Windows systems, including classic Windows 9x platforms. Supported operating systems: • Windows 11, Windows 10, Windows 8.1, Windows 8, Windows 7, Windows Vista, Windows XP, Windows Server 2022, Windows Server 2019, Windows Server 2016, Windows Server 2012, Windows Server 2008, Windows Server 2003, Windows 2000, Windows NT 4.0, Windows NT 3.51, Windows 95, Windows 98, Windows Me Supported languages: • English, Chinese (Simplified), Chinese (Traditional), Russian, Greek Changes: v5.88 10-14-26 Added GUID Class Names to [Lookup] (Menu->Help->SIV Lookup) and enable [WEB UPD] when later files are available. Added ASRock A520M-HVS ... |
|
20,308 | Oct 15, 2026 Ray Hinchliffe 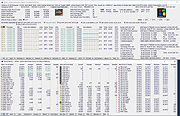 |
|
Universal Blood Pressure Manager v1.13.0 Universal Blood Pressure Manager v1.13.0 👉 Manage, track, and analyze blood pressure readings with a simple open-source logging tool. Universal Blood Pressure Manager is an open-source application designed to help users record and monitor their blood pressure readings. It provides a straightforward interface where users can log systolic and diastolic values, pulse rate, and additional notes for each measurement. Universal Blood Pressure Manager stores entries locally and allows users to keep a long-term history of their blood pressure readings. This makes it easier to track trends over time and share useful information with healthcare providers when needed. The program focuses on privacy, simplicity, and reliability while remaining lightweight and easy to use. Features: • Record systolic and diastolic blood pressure measurements • Log pulse rate and optional notes for each entry • Maintain a long-term history of blood pressure readings • Simple and easy-to-use interface for quick data entry • Local storage of data for privacy • Open-source project allowing community review and contributions Supported operating systems: • Windows 10, Windows 11 • Linux • macOS Supported languages: English Changes: v1.13.0 08-03-25 • Added the option to show the latest measurement in the title bar • Improved the database migration process • Updated translations • Minor improvements and fixes This download is for the Windows installer version (very bottom of page). All other download assets are below: Other Windows: ubpm_qt5-1.13.0-x86_64.exe(Try this version if the Qt6 version does not run properly on your system.) macOS: ubpm_qt6-1.13.0-x86_64+aarch64.dmg ubpm_qt5-1.13.0-x86_64+aarch64.dmg (Try this version if the Qt6 version does not run properly on your system.) Linux: ubpm_qt6-1.13.0-x86_64.AppImage ubpm_qt6-1.13.0-aarch64.AppImage ubpm_qt5-1.13.0-x86_64.AppImage ubpm_qt5-1.13.0-aarch64.AppImage (Try this version if the Qt6 version does not run properly on your system.) Click here to visit the author's website. |
|
699 | Mar 06, 2026 Thomas Lowe 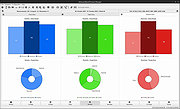 |
|
Venmon v2.37 Venmon v2.37 👉 Compact system monitoring and multi-ping tool for Windows. Venmon is a system resource monitoring and multi-ping tool for Windows. It can monitor system memory, processor, battery life, uptime, idle time, graphic cards, network traffic, event logs, and drives while using minimal processing power and memory. It displays real-time statistics, can run in portable mode from a USB drive, and does not require the installation of runtime modules. System The main screen of Venmon displays a general system summary, memory usage, processor usage, battery status, uptime, and idle time. System events will report activities such as Page file changes, battery activity (percentage charged/plugged/unplugged/charging/not charging), allocated memory changes, and report periods of long idle times. Long idle times can be used to see when someone last used the computer. Features: • Monitors memory, processor, battery life, uptime, idle time, graphics cards, network traffic, event logs, and drives • Displays real-time system statistics with low resource usage • Includes a multi-ping tool with support for up to 1024 automated pings by IP address or host name • Provides history graphs and event logging for system, storage, network, and ping activity • Supports portable use from a USB drive with settings saved locally • Includes Event Viewer, drive monitoring, network monitoring, and system tray features • Portable Supported operating systems: • Windows 7, Windows 8, Windows 10, Windows 11 • Windows Server 2000, Windows Server 2003, Windows Server 2008, Windows Server 2012, Windows Server 2016, Windows Server 2019, Windows Server 2022, Windows Server 2025 Supported languages: English, German Changes: v2.37 11-02-25 • Added Control + Mouse Wheel Down while hovering over Mini Window to make font size smaller • Added Control + Mouse Wheel Up while hovering over Mini Window to make font size bigger • Added Control + Mouse Wheel Down while hovering over Ping List to make font size smaller • Added Control + Mouse Wheel Up while hovering ... |
|
884 | Mar 12, 2026 Ventural 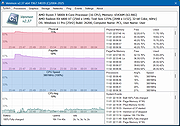 |
|
Wagnardsoft Tools (WTools) v1.0.9.5 Wagnardsoft Tools (WTools) v1.0.9.5 👉 Clean temporary files, repair Windows, and manage system settings from one utility. Wagnardsoft Tools (WTools) combines Windows cleanup, repair, monitoring, and maintenance features in one application. It finds unused Registry entries, removes temporary files from Windows and browsers, and helps repair corrupted system files. Its Home screen shows hardware, storage, and the status of selected performance settings. Beyond cleanup, WTools offers SSD TRIM, DPC latency monitoring, a performance overlay, Windows Update controls, and management of Microsoft Store apps. Advanced users can open Command Prompt and Registry Editor with SYSTEM privileges. Review the selected items before cleaning or changing Windows settings. Features: • Scan for unused Registry entries, including interface, class, and installer issues. • Select additional Registry categories for privacy traces and orphaned firewall rules. • Remove temporary files from Windows, the current user, and browsers. • Repair corrupted Windows system files. • View CPU, RAM, GPU, motherboard, operating system, and storage information. • Monitor DPC latency and view a chart covering the last 1, 5, or 15 minutes. • Display performance information in an overlay. • Run SSD TRIM with an adjustable optimization threshold. • Enable or disable Message Signaled Interrupts for supported NVIDIA cards before the RTX 3000 series. • Open Command Prompt and Registry Editor with SYSTEM privileges. • Manage Microsoft Store apps and hidden Windows updates. • Clean superseded components from the Windows WinSxS folder. • Adjust interface size from 100% to 150%. Supported operating systems: • Windows 7 SP1 with Extended Security Updates, Windows 8, Windows 8.1, Windows 10, Windows 11 Some features, including DPC latency monitoring, do not work on Windows 7. Supported languages: English, French, Spanish, German, ... |
|
4,101 | Sep 28, 2026 Wagnardsoft 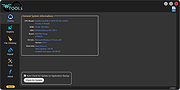 |
|
Wireless Network Watcher v2.45 Wireless Network Watcher v2.45 👉 Scans your wireless network and displays a list of all devices currently connected. Wireless Network Watcher is a lightweight network monitoring tool that scans your wireless network and displays a list of all computers and devices currently connected. The program quickly identifies devices on your network and provides useful information such as IP address, MAC address, device name, network adapter company, and connection status. Wireless Network Watcher can be useful for detecting unauthorized devices connected to your wireless network. It works by scanning a defined IP address range and presenting the results in a clear list, making it easy to identify computers, smartphones, tablets, routers, and other network hardware that are currently active. The utility is portable and does not require installation. It can also play a sound alert when a new device connects to the network and allows exporting the device list to various formats for reporting or monitoring purposes. Features: • Scans wireless networks and detects connected devices • Displays device information including IP address, MAC address, and device name • Identifies network adapter manufacturer from MAC address • Detects computers, phones, tablets, and other network hardware • Sound notification when new devices connect to the network • Export results to HTML, XML, CSV, or text files • Portable application that does not require installation • Simple interface designed for quick network scanning Supported operating systems: • Windows XP, Windows Vista, Windows 7, Windows 8, Windows 10, Windows 11 Supported languages: Arabic, Basque, Brazilian Portuguese, Bulgarian, Catalan, Croatian, Czech, Dutch, Finnish, French, German, Greek, Gujarati, Hebrew, Hellenic, Hungarian, Indonesian, Italian, Japanese, Korean, Latvian, Norwegian, Persian, Polish, Portuguese, Romanian, Russian, Serbian, Simplified Chinese, Slovak, Slovenian, Spanish, Swedish, Traditional Chinese, Thai, Turkish, Ukrainian, Valencian, Vietnamese Changes: v2.45 06-27-26 When a randomized MAC address is detected, it's displayed in the 'Network Adapter Company' column. Updated the internal MAC addresses database. This download is for the ... |
|
12,514 | Jul 01, 2026 Nir Sofer  |
| Showing rows 1 to 35 of 35 | Showing Page 1 of 1 | 1 |
OlderGeeks.com Copyright (c) 2026
