|
|

|
Processed through Paypal No account required. |
Buy our over-priced crap to help pay the bills.


|
|
|
Processed through Paypal No account required. |
| Files | ||||
| File Name | Rating | Downloads | ||
| All in One – System Rescue Toolkit v2026.05.01 All in One – System Rescue Toolkit v2026.05.01 👉 Bootable system recovery and repair toolkit for Windows, Linux, and Mac systems. All in One – System Rescue Toolkit is a powerful technician-focused rescue environment designed by veteran IT professional Paul Vreeland. Built to assist with diagnosing, repairing, recovering, and maintaining Windows, Linux, and macOS systems, it combines a bootable Linux-based recovery environment with native Windows and Linux repair tools. Whether you are dealing with malware infections, failed Windows updates, boot problems, hardware diagnostics, data recovery, password resets, disk maintenance, or network troubleshooting, AiO-SRT provides a centralized collection of carefully selected utilities that can be launched from a single interface. The toolkit is designed to be carried on a USB flash drive or bootable media and used both in situations where Windows is operational and when a computer can no longer boot normally. Unified logging records actions and command output, making troubleshooting and documentation easier. Automation features can queue multiple repair tasks, allowing technicians to continue working while routine maintenance and diagnostics run automatically. The project is released under the MIT License, making it free for both personal and commercial use. Features: • Bootable Linux-based rescue and recovery environment • Designed to boot on most Windows, Linux, and macOS hardware • Windows repair binaries for use within running Windows installations • Linux repair binaries for use within supported Linux distributions • Data recovery and file rescue tools • Windows password reset capabilities • Malware detection and removal utilities • Hardware diagnostics and stress testing tools • Disk management, partitioning, and storage maintenance utilities • Secure drive wiping and data destruction tools • Network discovery, troubleshooting, and connectivity testing tools • System information and hardware inventory tools • Unified logging of commands, results, and repair actions • Automation system for queuing multiple maintenance tasks • Multi-language and internationalization support • Web browser and productivity utilities included in the rescue environment • Free for ... |
 |
363 | Jun 16, 2026 Paul Vreeland 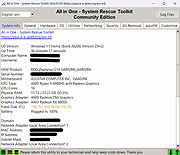 |
|
| AllThreadsView v1.00 AllThreadsView v1.00 👉 View all running Windows threads from every process in one table. AllThreadsView is a lightweight portable utility from NirSoft that displays every running thread from every active process on your Windows computer in a single, continuously updated list. Instead of examining one process at a time, you can instantly see detailed information for all system and application threads, making it much easier to troubleshoot performance problems, investigate application behavior, or inspect low-level process activity. Features: • Displays all running threads from every active process • Shows Thread ID, Process ID, Process Name and Process Path • Displays thread creation time, duration, kernel time and user time • Shows thread priority, base priority and wait reason • Displays the thread start address • Automatically refreshes the thread list • Option to display only active threads • Export selected or all items to TXT, CSV, HTML, XML and JSON • Portable application requiring no installation Supported operating systems: • Windows XP, Windows Vista, Windows 7, Windows 8, Windows 10 • Windows 11 • 32-bit and 64-bit editions Supported languages: English, Arabic, Basque, Bulgarian, Catalan, Czech, Danish, Dutch, Finnish, French, German, Greek, Hungarian, Italian, Japanese, Korean, Persian, Polish, Portuguese, Portuguese (Brazil), Romanian, Russian, Simplified Chinese, Slovak, Slovenian, Spanish, Swedish, Traditional Chinese, Turkish, Ukrainian Changes: v1.00 06-28-26 • First release. This download is for the Windows 64bit version (very bottom of page). If you need the Windows 32bit version, download here. Click here to visit the author's website. |
|
4,415 | Jun 29, 2026 Nir Sofer 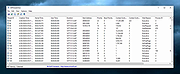 |
|
| AppCrashView v1.35 AppCrashView v1.35 👉 View application crash reports from Windows Error Reporting files. AppCrashView is a small NirSoft utility that displays details of application crashes stored in Windows Error Reporting .wer files. It shows crash information in a two-pane window, with the crash list on top and the selected crash report contents below. Crash lists can be saved to text, CSV, HTML, or XML files, or copied to the clipboard for use in Excel or another spreadsheet program. Features: • Displays application crash details from Windows Error Reporting .wer files • Two-pane interface shows crash list and full selected crash report • Save crash lists as text, tab-delimited, CSV, HTML, or XML • Copy selected crash information to the clipboard • Quick Filter support for instantly narrowing crash results • Open report file folder or process folder • Delete selected reports • Run as administrator option • Command-line export options • No installation required Supported operating systems: • Windows Vista, Windows 7, Windows Server 2008, Windows 8, Windows 10 Supported languages: English, Brazilian Portuguese, Danish, Dutch, French, German, Greek, Hungarian, Italian, Japanese, Korean, Persian, Polish, Romanian, Russian, Simplified Chinese, Slovak, Spanish, Swedish, Traditional Chinese, Valencian Changes: v1.35 Added 'Quick Filter' feature (View -> Use Quick Filter or Ctrl+Q). When turned on, you can type a string in the text box under the toolbar and AppCrashView will instantly filter the application crashes list, showing only lines that contain the string you typed. Click here to visit the author's website. |
|
6,037 | Jun 14, 2026 Nir Sofer 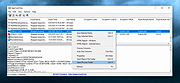 |
|
| Apple iPad 9th Gen. Wi-Fi A2602 820-02558 boardview & images. Apple iPad 9th Gen. Wi-Fi A2602 820-02558 boardview & images. Boardview & images for Apple iPad 9th Gen. Wi-Fi A2602 820-02558 mainboard. Note: Used in Apple iPad 9th Gen. Wi-Fi A2602 tablet. Use FlexBV5 to view the boardview file. Click here to visit the author's website. |
|
488 | May 16, 2026 Apple Corp. 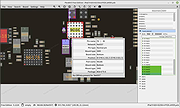 |
|
| BATExpert v1.14.5.27 BATExpert v1.14.5.27 Monitor and evaluate the health of your laptop battery. BATExpert gives you a crystal-clear vision of your laptop battery health status right at your fingertips. Designed specifically for notebook and laptop computers, it displays important battery information in a simple interface and helps you monitor battery condition, usage, and performance. BATExpert decodes battery manufacturer information and provides real-time details about charge status, current power usage, battery chemistry, and other useful metrics. The program can also estimate the remaining time before a low-battery warning occurs and recommends a battery upgrade when appropriate. Features: • Clear laptop battery manufacturer data decoding • Displays current charge status • Shows current usage and charge rate • Displays battery type (chemistry) • Displays battery temperature when available • Estimates time remaining before low-level warning • User-friendly interface • Internationalization support • Battery upgrade recommendations when appropriate Supported operating systems: • Windows XP, Windows Vista, Windows 7, Windows 8, Windows 8.1, Windows 10, Windows 11 Supported languages: • English Changes: v1.14.5.27 04-23-23 • Updated ICS library to v8.70 • Updated OpenSSL to v3.1.0 • Added ReactOS detection in logs • Improved Windows Server 2003 detection Click here to visit the author's website. |
|
10,718 | Jun 05, 2026 KC Softwares 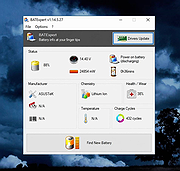 |
|
| Belarc Advisor v13.1 Belarc Advisor v13.1 👉 Creates a detailed profile of your PC’s hardware, software, and security status. Belarc Advisor builds a comprehensive report of your computer’s installed hardware, software, network inventory, missing Microsoft hotfixes, antivirus status, and security benchmarks. The report is generated locally and displayed in your web browser, ensuring that your data remains private and is not sent to any external server. Belarc Advisor is widely used for auditing systems, tracking installed software licenses, and identifying potential security risks. It provides a clear, organized breakdown of system components, including CPU, memory, storage devices, and connected peripherals, along with detailed software version information. Features: • Creates a complete system profile including hardware and software • Displays installed applications with version and license details • Identifies missing Microsoft security updates and hotfixes • Reports antivirus status and overall system security • Shows detailed network configuration and connected devices • Generates results locally for enhanced privacy (no data uploaded) • Provides browser-based report for easy viewing and printing • Tracks software licenses for auditing and recovery purposes • Displays detailed information about CPU, RAM, drives, and peripherals Supported operating systems: • Windows 7, Windows 8, Windows 10, Windows 11 Supported languages: English Changes: Not Provided Click here to visit the author's website. |
|
11,248 | Apr 29, 2026 Belarc, Inc.  |
|
| BootRacer v9.55 BootRacer v9.55 👉 Measure Windows boot speed and identify startup programs that slow your PC. BootRacer is a free utility for non-commercial use that accurately measures how long Windows takes to boot and helps identify startup programs that increase boot time. Unlike a simple stopwatch, it measures the actual Windows startup process while excluding password entry time, providing a more realistic view of system performance. BootRacer records each boot, tracks changes over time, and lets you compare results to determine whether your system is speeding up or slowing down. BootRacer also includes startup management tools that allow you to review, disable, delay, reorder, or customize startup applications so Windows can become usable more quickly. It displays detailed timing information for the boot process and startup programs, provides boot history with graphs and statistics, and can notify you when Windows has completely finished loading background services so you know when your computer is truly ready for use. Additional features such as service optimization and advanced system tweaks are available in the Premium edition. Features: • Measures true Windows boot time without including password entry delays • Monitors every boot and keeps a detailed boot history • Displays boot performance graphs and statistics • Identifies startup applications that slow Windows • Disable, delay, reorder, or customize startup programs • Shows the time consumed by individual startup applications • Compares current boot times with previous boots • Writes boot information to the Windows Event Log • Includes boot completion notifications when Windows is fully ready • Lightweight with minimal system resource usage • Free for personal, non-commercial use Supported operating systems: • Windows 2000, Windows XP, Windows Server 2003, Windows Vista, Windows 7, Windows 8, Windows 8.1, Windows 10, Windows 11 (32-bit and 64-bit) Supported languages: • English, Brazilian Portuguese, French, German, Hungarian, Italian, Japanese, Korean, Polish, Russian, Turkish, Ukrainian Changes: v9.55.2026.519 05-19-25 Fixed the timing race condition bug affecting applications launched from ... |
|
6,247 | Jun 26, 2026 Greatis Software 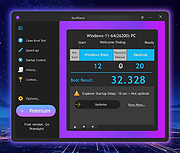 |
|
| Clear Disk Info v4.4.1.0 Clear Disk Info v4.4.1.0 👉 Monitor hard drive and SSD health information with a clean and easy-to-read interface. Clear Disk Info is a lightweight disk monitoring utility designed to display detailed SMART information for hard drives and SSDs. It helps users keep track of drive health, temperature, firmware details, power-on hours, transfer modes, and other important storage statistics in a clear and organized layout. The program supports multiple storage device types and provides quick access to essential diagnostic information for detecting potential drive problems before data loss occurs. Features: • Displays SMART health and diagnostic information for HDDs and SSDs • Shows drive temperature, health status, firmware, and serial numbers • Supports SATA, NVMe, and USB-connected storage devices • Monitors power-on hours, drive usage, and transfer modes • Clean and lightweight user interface with easy-to-read statistics • Provides real-time drive condition monitoring • Supports multiple drives simultaneously • Portable and installer versions available • Designed for fast access to essential disk health data Supported operating systems: • Windows 7, Windows 8, Windows 10, Windows 11 Supported languages: English Changes: v4.4.1 08-02-25 Refreshed the UI with a more modern font. Bug fixes Click here to visit the author's website. |
|
11,406 | May 19, 2026 Carifred 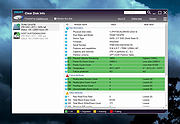 |
|
| CPU-Z v2.20.1 CPU-Z v2.20.1 👉 Free system profiling tool that provides detailed information about your CPU, motherboard, memory, and more. CPU-Z is a lightweight diagnostic utility designed to provide in-depth information about your computer’s hardware. It identifies the processor name and number, codename, process, package, cache levels, and real-time core frequency. It also reports detailed information about the motherboard including chipset, BIOS version, and graphic interface details. CPU-Z displays memory information such as type, size, timings, and specifications (SPD), making it especially useful for verifying RAM configurations. The software also includes a built-in benchmark and stress test to evaluate processor performance and compare results with other systems. Features: • Processor name, codename, architecture, process, package, and cache details • Real-time core frequency and multiplier monitoring • Mainboard manufacturer, model, chipset, and BIOS information • Memory type, size, timings, and SPD data for each module • Graphics interface information • Built-in CPU benchmark and stress test • Validation feature to share system configuration Supported operating systems: • Windows 7, Windows 8, Windows 10, Windows 11 Supported languages: English, French, Spanish, German, Italian, Portuguese, Chinese (Simplified), Chinese (Traditional), Japanese, Korean, Russian Changes: v2.20.1 05-25-26 AMD Ryzen 7 7700X3D (Raphael) (2.20.1). AMD Ryzen AI Max+ 495, 492, 488 (Gorgon Halo). AMD Ryzen AI Max 490, 485 (Gorgon Halo). AMD Ryzen AI Max PRO 495, 490, 485, 480 (Gorgon Halo). AMD Ryzen 9 9950X3D2 (Granite Ridge). AMD Ryzen 9 PRO 9965X3D, PRO 9945 (Granite Ridge). AMD Ryzen 7 PRO 9755, PRO 9745 (Granite Ridge). AMD Ryzen 5 PRO 9645 (Granite Ridge). AMD Ryzen AI 7/PRO 450G/GE (Gorgon Point 2). AMD Ryzen AI 5/PRO 440G/GE (Gorgon Point 2). AMD Ryzen AI 5/PRO 435G/GE (Gorgon Point 3). AMD Ryzen AI Max+ 392 (Strix Halo). Intel Core Ultra 5 250KF Plus (Arrow Lake Refresh). Intel Core 7 360 and 350 (Wildcat Lake). Intel Core 5 330, 320 and 315 (Wildcat Lake). Intel Core 3 304 (Wildcat Lake). Intel Core 9 273PQE, 273PTE, 273PE (Bartlett Lake). Intel Core 7 253PQE, 253PTE, 253PE, 251TE, 251E ... |
|
9,121 | May 26, 2026 CPUID 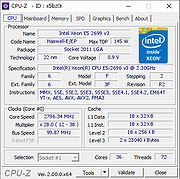 |
|
| CurrPorts v2.80 CurrPorts v2.80 👉 Monitor and manage all active TCP/IP and UDP network connections on your Windows PC. CurrPorts is a lightweight network monitoring utility that displays every open TCP/IP and UDP port currently in use on your system. It provides detailed information about each connection, including the local and remote addresses, ports, protocol, process name, process ID, executable path, process version, connection state, and more. The utility is especially useful for troubleshooting network problems, identifying which applications are communicating over the network, monitoring suspicious activity, and diagnosing unwanted Internet connections. CurrPorts allows you to close selected TCP connections, terminate the process that opened them, copy connection details, or export information to HTML, XML, CSV, and text formats. It can also automatically highlight suspicious connections belonging to applications without version information or icons, making it easier to spot potentially unwanted or unknown software. Advanced filtering, logging, automatic refresh, GeoIP location support, command-line operation, and portable use make it a valuable tool for both system administrators and advanced users. Features: • Displays all active TCP and UDP connections in real time. • Shows process name, ID, executable path, version, and file description. • Displays local and remote IP addresses, ports, protocol, and connection state. • Close selected TCP connections without terminating the application. • Kill processes directly from the connection list. • Automatically highlights suspicious connections. • Advanced filtering by process, protocol, address, port, and connection state. • Automatic refresh with configurable intervals. • Logs newly opened and closed connections. • Export connection information to HTML, XML, CSV, tab-delimited text, and clipboard. • Optional GeoIP country, city, and ASN information for remote addresses. • Command-line support for automation and scripting. • Portable executable requiring no installation. • Supports customizable columns, sorting, fonts, and display options. Supported operating systems: • Windows 2000, Windows XP, Windows Server 2003, Windows Server 2008, Windows Vista, Windows 7, Windows 8, Windows 8.1, Windows 10, Windows 11 Supported languages: Arabic, ... |
|
10,632 | Jul 30, 2026 Nir Sofer 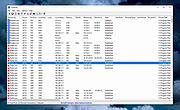 |
|
| DebugView v5.0 DebugView v5.0 👉 Monitor local and remote Windows debug output in real time. DebugView is a Sysinternals utility that captures and displays both Win32 and kernel-mode debug output from your local system or from remote computers you can reach over TCP/IP. It is designed for developers, administrators, and troubleshooters who want to view debug messages without attaching a traditional debugger. DebugView can also recover kernel-mode debug output from crash dump files when it was capturing at the time of the crash, and it includes tools for filtering, logging, searching, printing, and managing captured output. Features: • Captures Win32 OutputDebugString output • Captures kernel-mode DbgPrint output • Captures all kernel-mode DbgPrint variants implemented in Windows and Windows Server • Monitors debug output from local or remote computers over TCP/IP • Supports simultaneous monitoring of multiple remote systems • Recovers kernel-mode debug output from crash dump files when capture was active • Includes filtering and highlighting options for debug output • Lets you toggle display of process IDs for Win32 debug output • Copies selected output lines to the clipboard • Logs captured debug output to a file • Loads saved log files back into the output window • Prints all or part of captured output • Runs as a single executable file • Requires administrative privileges to view kernel-mode debug output Supported operating systems: • Windows Vista, Windows 7, Windows 8, Windows 10, Windows 11, Server Supported languages: English Changes: v5.0 03-26-26 Improves Windows 11 support and offers a modern UI with a dark theme, and includes performance optimizations. Click here to visit the author's website. |
|
505 | Apr 01, 2026 Microsoft Corp. 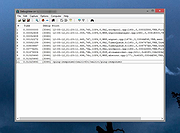 |
|
| DNS Hop v2.4 DNS Hop v2.4 👉 Benchmark and compare DNS providers to find the fastest and most reliable DNS for your network. DNS Hop is an open-source Windows utility designed to test and compare the performance of DNS services from multiple providers. By benchmarking thousands of available DNS endpoints, it helps users determine which DNS servers provide the fastest and most reliable performance for their specific network conditions. DNS Hop simplifies what can otherwise be a confusing process. Instead of manually trying different DNS providers and guessing which one performs best, the program runs automated tests against a large list of DNS servers and ranks them based on response time and reliability. Results are presented in an easy-to-read leaderboard, allowing users to quickly identify the best options. The application also provides recommendations based on the test results. Users can choose to manually apply these DNS settings or let DNS Hop configure them directly from within the program. This makes it easy to optimize DNS performance and potentially improve browsing speed and reliability. DNS Hop also allows exporting benchmark results for further analysis or record-keeping. Data can be exported as CSV or JSON files, and the performance chart can be copied as an image for sharing or documentation. Features: • Benchmarks thousands of DNS providers to measure performance • Ranks DNS servers by speed and reliability • Displays results in a clear leaderboard format • Provides recommendations for primary and secondary DNS servers • Allows direct DNS configuration from within the application • Export benchmark results as CSV or JSON files • Copy performance charts as PNG images • Lightweight open-source utility for DNS testing and optimization Supported operating systems: • Windows 10, Windows 11 Supported languages: English, German, French, Russian and Simplified Chinese, auto-detected from your OS UI language on first launch. Changes: v2.4 06-20-26 New resolvers and encrypted protocols NordVPN (Nord Threat Protection) public encrypted DNS, in three ... |
|
567 | Jul 20, 2026 center2055 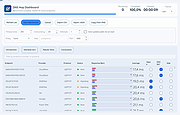 |
|
| FurMark 1 v1.39.3.0 FurMark 1 v1.39.3.0 Advanced GPU stress testing and graphics benchmarking utility. FurMark 1 is a powerful OpenGL-based GPU stress testing and benchmarking application designed to push graphics cards to their thermal and performance limits. Commonly used by enthusiasts, overclockers, and technicians, FurMark helps evaluate graphics card stability, cooling efficiency, and overall performance under extreme load conditions. FurMark 1 uses an intensive fur rendering engine that heavily loads the GPU, making it useful for detecting overheating issues, cooling problems, instability, graphical artifacts, or power delivery limitations. The application also provides benchmarking modes, fullscreen and windowed testing, custom resolutions, anti-aliasing options, frame rate monitoring, and GPU temperature tracking. FurMark 1 includes support for GPU monitoring utilities such as GPU-Z and GPU Shark, preset benchmark profiles, screenshot capture, and multi-GPU configurations. It is frequently used to validate graphics card stability after driver updates, hardware upgrades, or overclocking adjustments. Features: • Intensive GPU stress testing and burn-in benchmarking • OpenGL-based rendering engine • Real-time GPU temperature monitoring • Fullscreen and windowed benchmark modes • Custom resolutions and anti-aliasing support • GPU stability and overheating detection • Preset benchmark profiles • Multi-GPU support • FPS monitoring and performance statistics • Screenshot capture support • GPU information support through GPU-Z and GPU Shark • Portable and installer versions available • Useful for overclock stability testing and thermal validation Supported operating systems: • Windows 7, Windows 8, Windows 10, Windows 11 Supported languages: • English Changes: v1.39.3.0 10-08-25 + added support of AMD Radeon RX 7700, Radeon RX 7400 and Radeon PRO W7400. + added support of NVIDIA GeForce RTX 5050, RTX PRO 5000 and RTX 5090 D v2. + added support of AMD Radeon RX 9060 XT, Radeon RX 9060, Radeon RX 9070 GRE, Radeon AI PRO R9700. + added logos in benchmark score box for Qualcomm and Moore Threads. ! updated: GPU Shark 0.33.3.0. ! updated: GPU-Z 2.68.0 ! updated: ZoomGPU 1.43.0 (32-bit GPU monitoring library) Click here ... |
|
8,042 | Jun 05, 2026 Geeks3D 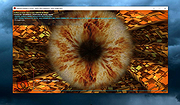 |
|
| FurMark 2 v2.10.2 FurMark 2 v2.10.2 OpenGL and Vulkan GPU stress test and graphics benchmark. FurMark 2 is the next-generation edition of the legendary GPU stress testing and benchmarking utility from Geeks3D. Designed for gamers, overclockers, system builders and hardware enthusiasts, FurMark 2 pushes graphics cards to their thermal and performance limits using demanding OpenGL and Vulkan rendering workloads. It is commonly used to test cooling performance, verify GPU stability, identify overheating issues, detect graphical artifacts, and benchmark overall graphics performance. Unlike the original FurMark 1, FurMark 2 introduces a redesigned engine with modern rendering technologies, Vulkan support, improved compatibility with current GPUs, and enhanced benchmarking capabilities. The software can run intensive fullscreen or windowed stress tests while displaying real-time GPU information including temperatures, clocks, usage, fan speeds, and performance statistics. FurMark 2 also includes benchmark presets for quick comparisons, customizable testing modes, anti-aliasing options, artifact scanning, and command-line support for automation and advanced diagnostics. Whether you are validating a fresh GPU installation, testing overclock stability, troubleshooting crashes, or simply comparing benchmark scores with other systems online, FurMark 2 provides a fast and reliable solution for GPU performance analysis. Features: • Advanced OpenGL and Vulkan GPU stress testing • Designed to heavily load GPUs for thermal and stability testing • Modern rendering engine optimized for current graphics hardware • Built-in benchmark presets for quick performance comparisons • Custom benchmark modes with adjustable resolution and anti-aliasing • Real-time GPU monitoring during testing sessions • Displays GPU temperature, clocks, fan speed, usage and performance data • Artifact scanner helps detect rendering errors and unstable overclocks • Supports fullscreen and windowed testing modes • Online benchmark score submission and comparison support • Useful for validating overclocking and cooling system performance • Command-line options for scripting and automated testing • Compatible with many NVIDIA, AMD and Intel graphics cards • Includes GPU information and hardware identification tools • Lightweight interface with quick access to common ... |
|
1,865 | Jun 05, 2026 Geeks3D 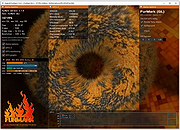 |
|
| GSmartControl v2.0.2 GSmartControl v2.0.2 👉 Hard disk and SSD health inspection tool using S.M.A.R.T. data. GSmartControl is a graphical user interface for smartctl (from smartmontools) that allows you to inspect the S.M.A.R.T. data of hard disk drives and solid-state drives to determine their health status. It supports ATA and SCSI devices and provides detailed drive information, attributes, error logs, and self-test results. GSmartControl enables you to run various self-tests, including short, extended, and conveyance tests, and displays the results in an easy-to-read format. It also provides drive identification information, capabilities, and statistics to help diagnose potential hardware issues before failure occurs. Features: • View detailed S.M.A.R.T. attributes and drive information • Perform short, extended, and conveyance self-tests • Automatic detection of ATA and SCSI devices • Display error logs and self-test logs • Advanced drive information and capability reporting • Cross-platform support Supported operating systems: • Windows 7, Windows 8, Windows 10, Windows 11 • macOS • Linux Supported languages: English Changes: v2.0.2 02-24-25 Support GCC 11 (and Ubuntu 22.04) by using and vendoring fmt library (#77). Support an option of saving smartctl output to text instead of JSON (#76). Restored pre-2.0.0 runtime support for smartctl < 7.3 (based on Text parser); this is an unsupported, old method without NVMe, provided for compatibility only (#77). Restored pre-2.0.0 support for standard (non-extended) self-test log found in very old ATA drives; the new JSON parser did not support this previously (#79). Better support for temperature values in JSON parser; this fixes unreasonably large temperature values (#78). Add a tooltip explaining self-test "lifetime hours" wrapping behavior (#73). Windows: Fixed a crash on Windows 7 when opening drive information by using Windows 7-compatible librsvg (#71). Windows: Avoid using non-integer font sizes. This download is for the Windows 64bit portable ... |
|
6,391 | Jun 29, 2026 Alexander Shaduri 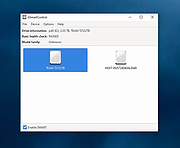 |
|
| HWiNFO v8.50 HWiNFO v8.50 👉 Professional hardware information, real-time monitoring, and diagnostics for Windows and DOS systems. HWiNFO is a comprehensive hardware analysis, system information, diagnostics, and real-time monitoring utility designed for enthusiasts, technicians, and IT professionals. It provides detailed information about virtually every hardware component in your computer while continuously monitoring temperatures, voltages, fan speeds, power usage, clocks, storage health, and many other sensor values. HWiNFO also generates comprehensive hardware reports, supports extensive logging, and integrates with numerous third-party monitoring applications through its shared memory interface. Features: • In-depth hardware information with detailed analysis of system components • Real-time monitoring of CPUs, GPUs, mainboards, drives, and peripherals • System health monitoring designed to help detect overheating, overload, performance loss, or possible failure • Extensive reporting with full hardware hierarchy or quick summary overview • Export reports in XML, CSV, and HTML formats • Customizable monitoring tables, graphs, tray icons, and OSD • Customizable alerts on monitored parameters with user-defined actions • Support for interfacing with other applications and third-party extensions • Shared Memory interface support for exposing sensor data • Clean and secure design with no personal data collection and no network transmission • Frequently updated to support new hardware, technologies, and standards Supported operating systems: • Windows 95 and later (x86, x64 or ARM64) Supported languages: English, French, German, Spanish, Portuguese (Brazil), Italian, Dutch, Danish, Chinese (Simplified), Chinese (Traditional), Japanese, Korean, Vietnamese, Arabic, Russian, Ukrainian, Czech, Slovak, Hungarian, Polish, Swedish, Finnish, Norwegian, Greek, Turkish, Latvian, Hebrew Changes: v8.50 07-08-26 Added fan speed monitoring on MSI Claw 8. Improved Intel Nova Lake support. Enhanced sensor monitoring on Maxsun 275HX series. Updated Intel PresentMon. Added monitoring of measured Core, Memory and XBAR clocks on NVIDIA GPUs. Fixed lost Custom and WHEA sensors. Added reporting of ACPI version. Improved Corsair Link device support. Added Display Audio monitor capability information. Added option to change OSD background color. Fixed recognition of AMD Radeon RX 6500XT. Fixed a possible crash when sensor name is too long. This ... |
|
13,143 | Jul 09, 2026 REALiX 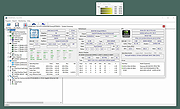 |
|
| IPNeighborsView v1.03 IPNeighborsView v1.03 👉 View detailed information about computers and devices recently detected on your local network. IPNeighborsView is a lightweight, portable network utility that displays the IP neighbor table maintained by Windows. The IP neighbor table contains computers, routers, printers, smartphones, and other network devices that Windows has recently communicated with on your local network. The program displays detailed information for every detected entry, including the IP address, MAC address, MAC address vendor, address type, state, state duration, local network adapter, interface index, and connection name. IPNeighborsView can also detect randomized MAC addresses used by many modern mobile devices and clearly identifies them in the manufacturer column. IPNeighborsView requires no installation and can be run directly from any folder or portable drive. Selected entries can be copied to the clipboard or exported to text, CSV, tab-delimited, HTML, XML, and JSON formats. Permanent neighbor table entries are hidden by default but can be displayed through the Options menu when needed. Features: • Displays the Windows IP neighbor table • Lists computers and devices recently detected on the local network • Shows IPv4 and IPv6 addresses • Displays MAC addresses and associated hardware vendors • Detects and labels randomized MAC addresses • Shows address type and neighbor state information • Displays state duration for each entry • Identifies the local network adapter and connection name • Optionally displays permanent neighbor table entries • Copy selected entries directly to the clipboard • Export data to Text, CSV, Tab-delimited, HTML, XML, or JSON • Includes command-line options for automated exports • Portable with no installation required • Supports both 32-bit and 64-bit Windows Supported operating systems: • Windows Vista, Windows 7, Windows 8, Windows 8.1, Windows 10, Windows 11 Supported languages: English, Dutch, French, German, Greek, Hungarian, Italian, Japanese, Persian, Polish, Russian, Simplified Chinese, Slovak, Traditional Chinese, Turkish Changes: v1.03 07-15-26 When a randomized MAC address is detected, it is displayed in the MAC Address Company column. Updated the ... |
|
3,173 | Jul 30, 2026 Nir Sofer 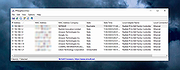 |
|
| LANIPScanner v1.10 LANIPScanner v1.10 👉 Scans your local network and displays the IP and MAC address of all connected devices. LANIPScanner is a lightweight network scanning utility that quickly detects computers and devices connected to your local area network (LAN). It works by scanning a specified IP address range and listing all active devices it finds, including useful details such as IP address and MAC address. This makes it easy to identify computers, printers, routers, and other network-enabled devices currently active on your network. LANIPScanner requires no installation and runs as a simple portable application. It is designed for speed and simplicity, allowing users to quickly view the devices on their LAN without complicated configuration. The tool is especially useful for troubleshooting network connectivity, identifying unknown devices, or verifying which systems are currently active on a network. Features: • Scans a specified IP address range on your local network • Displays detected devices with their IP and MAC addresses • Fast scanning engine for quick device discovery • Simple, lightweight, and portable utility with no installation required • Ideal for identifying active devices and troubleshooting LAN connections Supported operating systems: • Windows Vista, Windows 7, Windows 8, Windows 10, Windows 11 Supported languages: English, Dutch, French, German, Greek, Hungarian, Italian, Japanese, Polish, Russian, Simplified Chinese, Slovak, Traditional Chinese, Ukrainian Changes: v1.10 05-27-26 Added 'Put Icon On Tray' option. Note: This file has two hits on VirusTotal. We have confirmed these to be false positives. The file is safe. Click here to visit the author's website. |
 |
1,135 | Jul 20, 2026 Nir Sofer 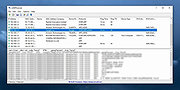 |
|
| Microsoft Sysinternals Suite v2026.7 Microsoft Sysinternals Suite v2026.7 👉 A complete collection of Microsoft's advanced Windows system utilities. Microsoft Sysinternals Suite is a comprehensive package containing Microsoft's renowned Sysinternals troubleshooting, diagnostic, monitoring, and system management utilities in a single download. Created by Mark Russinovich and the Sysinternals team, the suite provides administrators, developers, IT professionals, and power users with portable tools for analyzing processes, monitoring system activity, managing startup entries, inspecting security settings, recovering information, and troubleshooting Windows systems. The suite is regularly updated as individual utilities receive new features and improvements. Features: • Includes over 70 portable Sysinternals utilities in one package • No installation required - simply extract and run the tools • Monitor running processes with Process Explorer • Capture real-time file system, Registry, and process activity with Process Monitor • Analyze Windows startup entries using Autoruns • View TCP and UDP network connections with TCPView • Securely delete files using SDelete • Verify digital signatures with Sigcheck • Display system information with BgInfo • Examine handles, DLLs, services, sessions, and security permissions • Includes command-line and graphical utilities • Frequently updated by Microsoft with new tools and enhancements Supported operating systems: • Windows 10, Windows 11, Windows Server 2016, Windows Server 2019, Windows Server 2022, Windows Server 2025 (all 64bit) Supported languages: • English Changes: v2026.7 07-05-26 Updated the Sysinternals Suite package with the latest releases of the included Sysinternals utilities. Note: This file has three hits on VirusTotal. VirusTotal reports detections for Sysinternals tools such as PsExec because they are legitimate administrative utilities that can also be abused by attackers. These detections are generally classified as HackTool or Potentially Unwanted Application (PUA) rather than malware. These tools are safe and widely used by IT professionals and system administrators. This download is for the Windows version (very bottom of page). All other download assets are below: ARM64: SysinternalsSuite-ARM64.zip Nano Server: SysinternalsSuite-Nano.zip Click here to visit the author's website. |
|
11,144 | Jul 10, 2026 Microsoft Corp.  |
|
| NetworkConnectLog v1.18 NetworkConnectLog v1.18 👉 Monitor and log devices connecting to and disconnecting from your local network. NetworkConnectLog is a lightweight, portable network monitoring utility that continuously scans your local area network using ARP and NetBIOS protocols, recording every device that connects to or disconnects from your network. It is ideal for home users, technicians, and network administrators who want to keep track of network activity, identify unknown devices, or troubleshoot intermittent connection issues. The program immediately performs an initial scan to detect all currently connected devices, then continues monitoring in the background for connection and disconnection events. Each log entry includes useful information such as the event time, IP address, computer name, workgroup, MAC address, and network adapter manufacturer. Logs can be searched, sorted, filtered, and exported to several common formats for documentation or further analysis. Features: • Portable application requiring no installation • Automatically detects computers and devices joining or leaving your network • Uses ARP and NetBIOS protocols for device detection • Displays connection and disconnection timestamps • Shows IP address, computer name, workgroup, MAC address, and network adapter manufacturer • Performs continuous background monitoring • Configurable network adapter and IP address scanning range • Adjustable scan interval • Automatically export logs whenever changes are detected • Export logs to TXT, CSV, HTML, XML, or tab-delimited files • Search and sort recorded events • Customizable font and MAC address display format • System tray support • Optional always-on-top mode • Optional black background display mode • High DPI display support Supported operating systems: • Windows 2000, Windows XP, Windows Vista, Windows 7, Windows 8, Windows 8.1, Windows 10, Windows 11 (32-bit and 64-bit) Supported languages: • English, Arabic, Brazilian Portuguese, Dutch, French, German, Greek, Hungarian, Italian, Japanese, Persian, Polish, Romanian, Russian, Simplified Chinese, Slovak, Spanish, Traditional Chinese, Turkish, Valencian Changes: v1.18 07-01-26 Updated the internal MAC addresses database. Click here to visit the author's website. |
|
7,023 | Jul 03, 2026 Nir Sofer 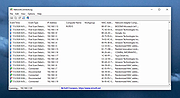 |
|
| Novabench v6.0.3 Novabench v6.0.3 👉 Free PC benchmarking and hardware performance testing utility. Novabench is a free benchmarking program that allows you to quickly test and evaluate your computer’s overall performance. It measures CPU, GPU, RAM, and storage speeds using a simple interface designed for both casual users and technicians. The free version provides a complete system benchmark score along with detailed hardware information and comparison tools to help identify performance bottlenecks or hardware problems. Novabench can be useful for checking system stability after upgrades, comparing hardware performance against similar systems, troubleshooting slow computers, and monitoring the effects of overclocking or driver updates. Benchmark results can also be uploaded online to compare your PC with other systems using the Novabench database. Features: • Free CPU, GPU, RAM, and disk benchmarking • Generates an overall system performance score • Quick benchmark testing with minimal setup required • Displays detailed hardware and system information • Compare benchmark results with other systems online • Useful for testing gaming PCs, laptops, and workstations • Helps identify hardware bottlenecks and slow components • Portable benchmark results that can be shared online • Lightweight interface suitable for beginners and technicians • Supports stress testing and stability verification tools • Includes temperature and hardware monitoring support • Can help verify system improvements after upgrades or repairs Supported operating systems: • Windows 10, Windows 11 • macOS 11 Big Sur or higher • Linux distributions supporting modern x86-64 hardware Supported languages: • English Changes: v6.0.3 06-09-26 • Improved benchmark reliability and scoring consistency • Updated hardware detection and compatibility support • General bug fixes and stability improvements This download is for the Windows installer version (very bottom of page). All other download assets are below: Other Windows: novabench-arm64.exe macOS: novabench.dmg Linux: novabench-x64.deb novabench-arm64.deb novabench-x64.rpm novabench-arm64.rpm Click here to visit the author's website. |
|
7,548 | Jun 09, 2026 Novawave Inc. 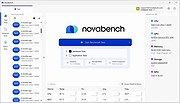 |
|
| O&O DeskInfo v2.0.1033 O&O DeskInfo v2.0.1033 👉 Portable desktop system monitor that displays real-time hardware and network information directly on your desktop. O&O DeskInfo displays essential system information such as CPU usage, memory consumption, drive activity, network connections, battery status, and more directly on the Windows desktop in real time. The portable freeware utility allows users to monitor system activity without opening additional tools or menus. It also supports customizable layouts, colors, transparency, fonts, and multi-monitor positioning. O&O DeskInfo can quickly copy system details to the clipboard for troubleshooting and support purposes and includes warnings for unknown USB device connections. Features: • Real-time display of CPU, memory, drive, and network activity • Portable application with no installation required • Customizable desktop display position, colors, fonts, and transparency • Performance charts for CPU, memory, and network monitoring • Battery status display support for compatible systems • Detection of virtual machines • Profile editor with customizable columns and sortable categories • Clear distinction between local, removable, and network drives • Clipboard export for quick support and troubleshooting • Multi-monitor support • Warning notifications for unknown USB device connections • Adjustable update speeds and display modes • Tray icon integration with quick access functions • Automatic startup option with Windows Supported operating systems: • Windows 10 • Windows 11 Supported languages: • English, German, French Changes: v2.0.1033 01-28-26 • NEW: New performance charts for CPU, memory and network • NEW: Battery status display, if supported by the system • NEW: Detection of virtual machines • NEW: Greater flexibility in the profile editor with freely selectable columns and re-sortable categories • NEW: Improved customization options for the size of performance charts • NEW: Unified controls for a more consistent and clearer user interface • NEW: Extended documentation • NEW: Clearer distinction between local, removable and network drives • CHANGED: Performance charts react faster and more smoothly to display setting changes • CHANGED: Charts make better use of available space and appear overall clearer • CHANGED: Reduced visual duplication for a calmer display • ... |
|
3,447 | May 24, 2026 O&O Software GmbH  |
|
| SIV (System Information Viewer) v5.87 SIV (System Information Viewer) v5.87 👉 Detailed Windows system, hardware, sensor, and network information utility. SIV (System Information Viewer) is a general Windows utility for displaying extensive system information, including CPU, PCI, PCMCIA, USB, SMBus, SPD, ACPI, machine, hardware sensor, network, and operating system details. It can also control certain AIO devices such as fans and LEDs by using the appropriate command-line option Features: • Displays detailed CPU information including processor type, features, clock speeds, and topology. • Reports motherboard, chipset, BIOS information, and firmware details. • Shows comprehensive PCI, PCIe, EISA, and PCMCIA device information. • Provides SMBus and SPD data including memory module information and sensor readings. • Displays detailed hardware sensor information including temperatures, voltages, and fan speeds. • Reports GPU information including PCIe link speed and lane configuration. • Shows USB device information and connected hardware details. • Displays ACPI information and power management related system data. • Provides detailed operating system information including installed updates and system configuration. • Shows network adapter information, IP configuration, and network statistics. • Supports viewing hardware I/O ports and device resource allocations. • Includes tools to view ghost devices and hidden hardware entries in the system. • Can generate and save detailed system reports for diagnostics or troubleshooting. • Allows optional control of supported AIO devices such as fans and LEDs via command-line options. • Designed to work across both modern and legacy Windows systems, including classic Windows 9x platforms. Supported operating systems: • Windows 11, Windows 10, Windows 8.1, Windows 8, Windows 7, Windows Vista, Windows XP, Windows Server 2022, Windows Server 2019, Windows Server 2016, Windows Server 2012, Windows Server 2008, Windows Server 2003, Windows 2000, Windows NT 4.0, Windows NT 3.51, Windows 95, Windows 98, Windows Me Supported languages: • English, Chinese (Simplified), Chinese (Traditional), Russian, Greek Changes: v5.87 05-14-26 Improved Dual/Single Channel memory reporting for early AMD Athlon 64 CPUs such as Manchester and Toledo. Resolved issue with [Sort] ... |
|
19,506 | May 14, 2026 Ray Hinchliffe 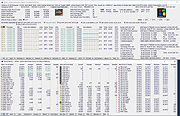 |
|
| WhySoSlow Free Home Edition v1.61 WhySoSlow Free Home Edition v1.61 👉 Analyze system performance and identify why your computer is running slowly. WhySoSlow Free Home Edition is a diagnostic utility designed to help users quickly determine the causes of poor system performance. It analyzes your computer in real time and provides insights into issues such as CPU throttling, memory bottlenecks, disk performance problems, and other hardware or software limitations that may be slowing down your system. The program performs a series of checks and presents easy-to-understand results, making it useful for both casual users and more advanced troubleshooting scenarios. It helps pinpoint whether performance issues are caused by hardware limitations, thermal throttling, insufficient RAM, or background processes. Features: • Real-time system performance analysis • Detects CPU speed issues and throttling • Identifies memory and disk bottlenecks • Measures system responsiveness and load • Provides detailed system diagnostics and benchmarks • Helps pinpoint hardware or software causes of slowdowns • Simple interface with clear performance indicators Supported operating systems: • Windows 11, Windows 10 (x86 and x64), Windows 8.1 (x86 and x64), Windows 8 (x86 and x64), Windows 7 (x86 and x64) • Windows 2022 Server, Windows 2016 Server (x86 and x64), Windows 2012 Server (x86 and x64) Supported languages: English Changes: v1.61 10-22-20 Bug Fixed: "this version of WhySoSlow is not compatible with your operating system version" On certain systems, WhySoSlow could display a message "this version of WhySoSlow is not compatible with your operating system version". This has been fixed. Click here to visit the author's website. |
|
4,647 | Mar 24, 2026 Resplendence Software 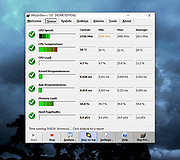 |
|
| WifiInfoView v3.00 WifiInfoView v3.00 👉 Scan and analyze nearby wireless networks with detailed Wi-Fi information. WifiInfoView is a free, portable utility that scans all wireless networks within range and displays detailed technical information about each one. It provides network names (SSID), MAC addresses, signal strength, channel numbers, frequencies, PHY types, maximum supported speeds, security status, router manufacturer, and other useful details for troubleshooting or optimizing wireless networks. Advanced users can also inspect the raw Wi-Fi information elements transmitted by each access point in hexadecimal format. WifiInfoView includes a summary mode that groups detected networks by channel, router manufacturer, PHY type, or maximum speed, making it easy to identify congested channels and optimize wireless performance. Features: • Portable application requiring no installation • Scans and displays nearby wireless networks in real time • Shows SSID, MAC address, PHY type, RSSI, signal quality, frequency, and channel • Displays router manufacturer, model, and name when available • Shows network security status and maximum supported connection speed • Summary mode groups networks by channel, manufacturer, PHY type, or speed • View raw Wi-Fi information elements in hexadecimal format • Export selected information to multiple file formats • Filter, sort, and search detected wireless networks • Supports both 32-bit and 64-bit Windows systems Supported operating systems: • Windows Vista, Windows Server 2008, Windows 7, Windows 8, Windows 10, Windows 11 Supported languages: • Arabic, Basque, Bulgarian, Catalan, Chinese Simplified, Chinese Traditional, Croatian, Czech, Danish, Dutch, English, Finnish, French, German, Greek, Hebrew, Hungarian, Italian, Japanese, Korean, Norwegian, Persian, Polish, Portuguese, Portuguese (Brazil), Romanian, Russian, Slovak, Slovenian, Spanish, Swedish, Thai, Turkish, Ukrainian, Vietnamese Changes: v3.00 06-10-26 • Added "Keep Selected Item Visible" option. When enabled, the selected item always remains visible. Note: This file has two hits on VirusTotal. We have confirmed these to be false positives. The file is safe. This download is for the Windows 64bit version (very bottom of page). If you need the Windows 32bit version, ... |
|
6,542 | Jun 23, 2026 Nir Sofer 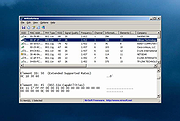 |
|
| Showing rows 1 to 25 of 25 | Showing Page 1 of 1 | 1 |
OlderGeeks.com Copyright (c) 2026
