|

|
Processed through Paypal No account required. |








Buy our over-priced crap to help pay the bills.



|
|
Processed through Paypal No account required. |
| Files | ||||
| File Name | Rating | Downloads | ||
 |
AppControl v1.3.0.335b AppControl v1.3.0.335b 👉 Historical Task Manager with powerful application control, privacy monitoring, and system insights. AppControl is a free Windows system monitoring and application management utility developed by Jon Hundley and the AppControl team. Rather than only showing what your computer is doing right now, AppControl continuously records system activity for up to 72 hours, allowing you to review past CPU, GPU, memory, disk, temperature, and application activity to identify exactly what happened when your PC slowed down, overheated, or behaved unexpectedly. AppControl also extends far beyond the capabilities of the standard Windows Task Manager by providing detailed information about running processes, historical hardware usage, application launches, privacy events, and system activity. It can alert you when new or unsigned applications run, when software accesses your webcam, microphone, or location, and allows you to permanently disable unwanted applications or block entire publishers with custom rules. Built-in plain-language descriptions explain what Windows processes and executables actually do, making it easier to understand what's happening on your PC without searching the web Features: • Historical CPU, GPU, memory, disk, and temperature monitoring • Review up to 72 hours of recorded system activity • Timeline graphs with click-and-drag zoom • Monitor application launches, updates, and system events • Alerts for new, unusual, or unsigned applications • Privacy alerts for webcam, microphone, and location access • Permanently disable unwanted applications • Block entire software publishers • Plain-language descriptions of running processes and executables • Command-line monitoring tool for Windows Terminal, PowerShell, and Command Prompt • Automatic light and dark theme support • Custom notification options • Search and investigate running applications quickly Supported operating systems: • Windows 10 • Windows 11 Supported languages: English, German, Spanish, Japanese, French, Polish, Russian, Dutch, Serbian (Cyrillic), Italian, Turkish, Chinese Changes: v1.3.0.335b 05-14-26 Added range selection and zooming on timeline graphs. Added a command-line monitoring tool for Windows Terminal, PowerShell, and Command Prompt. Added an automatic theme that matches Windows light or dark mode. Added ... |
 |
822 | Jun 27, 2026 Jon Hundley and Team 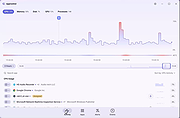 |
 |
BATExpert v1.14.5.27 BATExpert v1.14.5.27 Monitor and evaluate the health of your laptop battery. BATExpert gives you a crystal-clear vision of your laptop battery health status right at your fingertips. Designed specifically for notebook and laptop computers, it displays important battery information in a simple interface and helps you monitor battery condition, usage, and performance. BATExpert decodes battery manufacturer information and provides real-time details about charge status, current power usage, battery chemistry, and other useful metrics. The program can also estimate the remaining time before a low-battery warning occurs and recommends a battery upgrade when appropriate. Features: • Clear laptop battery manufacturer data decoding • Displays current charge status • Shows current usage and charge rate • Displays battery type (chemistry) • Displays battery temperature when available • Estimates time remaining before low-level warning • User-friendly interface • Internationalization support • Battery upgrade recommendations when appropriate Supported operating systems: • Windows XP, Windows Vista, Windows 7, Windows 8, Windows 8.1, Windows 10, Windows 11 Supported languages: • English Changes: v1.14.5.27 04-23-23 • Updated ICS library to v8.70 • Updated OpenSSL to v3.1.0 • Added ReactOS detection in logs • Improved Windows Server 2003 detection Click here to visit the author's website. |
|
10,984 | Jun 05, 2026 KC Softwares 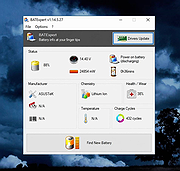 |
|
Clear Disk Info v4.4.1.0 Clear Disk Info v4.4.1.0 👉 Monitor hard drive and SSD health information with a clean and easy-to-read interface. Clear Disk Info is a lightweight disk monitoring utility designed to display detailed SMART information for hard drives and SSDs. It helps users keep track of drive health, temperature, firmware details, power-on hours, transfer modes, and other important storage statistics in a clear and organized layout. The program supports multiple storage device types and provides quick access to essential diagnostic information for detecting potential drive problems before data loss occurs. Features: • Displays SMART health and diagnostic information for HDDs and SSDs • Shows drive temperature, health status, firmware, and serial numbers • Supports SATA, NVMe, and USB-connected storage devices • Monitors power-on hours, drive usage, and transfer modes • Clean and lightweight user interface with easy-to-read statistics • Provides real-time drive condition monitoring • Supports multiple drives simultaneously • Portable and installer versions available • Designed for fast access to essential disk health data Supported operating systems: • Windows 7, Windows 8, Windows 10, Windows 11 Supported languages: English Changes: v4.4.1 08-02-25 Refreshed the UI with a more modern font. Bug fixes Click here to visit the author's website. |
|
11,612 | May 19, 2026 Carifred 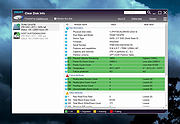 |
|
CoolerControl v4.3.1 CoolerControl v4.3.1 👉 Monitor and control cooling devices, fan curves, RGB lighting, and system temperatures on Linux. CoolerControl is a powerful Linux application for monitoring and managing your PC's cooling hardware from a single modern interface. It combines support for standard hardware monitoring with advanced fan and pump control, custom temperature sensors, RGB lighting management, dashboards, and automation profiles. CoolerControl works with many motherboard sensors, GPUs, AIO liquid coolers, and other supported devices through Linux hardware monitoring frameworks and supported back-end services. The application provides real-time monitoring of temperatures, fan speeds, pump speeds, voltages, utilization, and other hardware statistics while allowing you to create custom fan curves based on multiple temperature sources. Built-in dashboards, profiles, and automation make it easy to optimize cooling for quiet operation, gaming, or maximum performance. Features: • Monitor CPU, GPU, motherboard, storage, and other hardware sensors • Create custom fan and pump curves • Control supported RGB lighting devices • Build custom dashboards for system monitoring • Create and switch between cooling profiles and modes • Use multiple temperature sources for intelligent fan control • Support custom sensors and calculated values • View real-time graphs and historical statistics • Configure alerts and advanced device settings • Support supported liquid coolers, fan controllers, and motherboard sensors • Automatic detection of supported hardware • Modern desktop interface with dark theme support • Includes both desktop application and background daemon Supported operating systems: • Arch Linux • Debian 12 Bookworm or higher • Fedora • NixOS • openSUSE Tumbleweed • Ubuntu 22.04 or higher Supported languages: English Changes: v4.3.1 05-23-26 Added True Duty Mapping calibration for RPM-reporting fans and pumps. Added automatic kick-in boost detection during calibration with configurable behavior. Added disconnected fan and diagnostic reporting during calibration. Added calibration popover with duty-to-RPM relationship graph. Added reset button for Table View statistics. Added quick-menu links for creating Dashboards and Modes. Changed Table View statistics to span the full daemon runtime. Fixed Dashboard time axis display when changing filters in smaller windows. Installation: This download includes ... |
|
1,225 | Jul 09, 2026 Guy Boldon 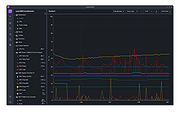 |
|
Core Temp v1.21 Core Temp v1.21 👉 Compact CPU monitoring utility for tracking processor temperatures, loads and other vital information. Core Temp is a small, lightweight processor monitoring utility designed to display the temperature of each individual CPU core in real time. It reads the Digital Thermal Sensors built into modern Intel, AMD and VIA x86 processors, providing accurate temperature information directly from the processor rather than relying on motherboard sensors. It can also display processor model information, frequencies, load levels, power-related data and minimum, maximum and average temperature readings. Core Temp offers customizable notification-area monitoring, logging, Mini-Mode and support for plug-ins that can extend its functionality. Features: • Monitors the temperature of individual CPU cores in real time • Reads temperatures directly from the processor's Digital Thermal Sensors • Supports Intel, AMD and VIA x86 processors • Displays processor identification and model information • Shows individual core load information • Displays processor frequency information • Tracks minimum, maximum and average temperature readings • Provides configurable notification-area sensor displays • Includes a battery status indicator for the notification area • Includes a compact Mini-Mode display • Adjustable user-interface zoom • Can log processor temperature and monitoring information • Supports multiple processors and multiple cores • Motherboard-independent temperature monitoring • Provides shared-memory data for other applications • Supports plug-ins and add-ons for expanded functionality • Lightweight design with a small system footprint Supported operating systems: • Windows XP, Windows 7, Windows 8, Windows 8.1, Windows 10, Windows 11 • Windows Server 2003, Windows Server 2008, Windows Server 2012, Windows Server 2016, Windows Server 2019, Windows Server 2022, Windows Server 2025 Supported languages: English, Abkhaz, Armenian, Bulgarian, Simplified Chinese, Traditional Chinese, Catalan, Czech, Danish, Dutch, Finnish, French, Galician, German, Greek, Hebrew, Hungarian, Italian, Japanese, Korean, Norwegian, Polish, Portuguese, Romanian, Russian, Slovak, Slovenian, Spanish, Swedish, Turkish, Ukrainian, Vietnamese Changes: v1.21 10-03-26 - New: Redesign the notification tray configuration dialog. Should now be more intuitive and flexible. - Fix: Notification tray icons issues; missing ... |
|
5,447 | Oct 14, 2026 Arthur Liberman 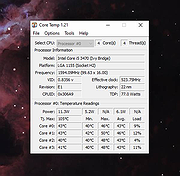 |
|
CrystalDiskInfo v9.9.3 CrystalDiskInfo v9.9.3 👉 Monitor and analyze the health and performance of your hard drives and SSDs. CrystalDiskInfo is a free hard drive health monitoring utility that provides detailed information about your storage devices, including HDDs, SSDs, and NVMe drives. It reads S.M.A.R.T. (Self-Monitoring, Analysis and Reporting Technology) data to help detect potential drive failures before they happen. CrystalDiskInfo displays temperature, health status, firmware version, serial number, interface, transfer mode, drive letters, and total host reads and writes for supported devices. It supports a wide range of storage interfaces and gives users a clear overview of drive condition through an easy-to-read interface with color-coded health indicators. CrystalDiskInfo is lightweight, easy to use, and ideal for anyone who wants to keep an eye on their system’s storage reliability and performance. Features: • Displays detailed S.M.A.R.T. information • Real-time drive temperature monitoring • Health status indicators with color coding • Supports HDD, SSD, and NVMe drives • Shows firmware, serial number, and interface details • Tracks total host reads and writes • Alert notifications for critical drive conditions • Lightweight and easy-to-use interface Supported operating systems: • Windows XP, Windows Vista, Windows 7, Windows 8, Windows 10, Windows 11 Supported languages: Abkhazian, Arabic, Armenian, Azerbaijani, Bulgarian, Catalan, Croatian, Czech, Danish, Dutch, English, Filipino, Finnish, French, Galician, German, Greek, Hebrew, Hungarian, Italian, Japanese, Korean, Lithuanian, Norwegian, Persian, Polish, Portuguese (Brazil), Portuguese (Portugal), Romanian, Russian, Serbian, Simplified Chinese, Slovak, Slovenian, Spanish, Swedish, Thai, Traditional Chinese, Turkish, Ukrainian, Vietnamese Changes: v9.9.3 10-11-26 Fixed: Transfer Mode Display for JMicron External Controllers Improved: SanDisk SSD SSD support Updated: Language files (Traditional Chinese) Click here to visit the author's website. |
|
10,672 | Oct 12, 2026 hiyohiyo  |
|
Fan Control v275 Fan Control v275 👉 Highly customizable fan control software for Windows. Fan Control is a focused and highly customizable fan controlling software for Windows that lets you control CPU, GPU, and case fans using temperature-based logic. It supports guided setup, multiple profiles, theme customization, multiple temperature sources, several fan curve functions including custom graphs, mixed fan curves and sensors using max, min, or average logic, low resource usage, and advanced tuning options such as steps, start and stop percentages, response time, and hysteresis. Features: • Guided setup process on first launch • Save, edit, and load multiple profiles • Change the theme and color of the application • Multiple temperature sources including CPU, GPU, motherboard, and hard drives • Multiple fan curve functions, including a custom graph • Mix fan curves or sensors together using max, min, or average • Low resource usage • Advanced tuning with steps, start %, stop %, response time, and hysteresis • Extensive support for CPU, GPU, case fans, and other hardware such as AIOs • Plugin support for adding third-party temperature, speed, or control sensors Fan curve types • Auto: PI-ish type function. % will surf until temp is stable at load. • Linear : Temperature based linear function • Graph : Temperature based custom curve • Target: Temperature based that holds speed until target temperature is reached • Mix : Use two different curves and apply a mix function (Min, Max, Sum, Average) • Sync : Sync to an existing control • Flat: Set a fixed % Graph fan curve editor • Change the temperature range for finer control ... |
|
7,183 | Aug 26, 2026 Rem0o 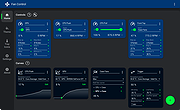 |
|
FurMark 1 v1.39.3.0 FurMark 1 v1.39.3.0 Advanced GPU stress testing and graphics benchmarking utility. FurMark 1 is a powerful OpenGL-based GPU stress testing and benchmarking application designed to push graphics cards to their thermal and performance limits. Commonly used by enthusiasts, overclockers, and technicians, FurMark helps evaluate graphics card stability, cooling efficiency, and overall performance under extreme load conditions. FurMark 1 uses an intensive fur rendering engine that heavily loads the GPU, making it useful for detecting overheating issues, cooling problems, instability, graphical artifacts, or power delivery limitations. The application also provides benchmarking modes, fullscreen and windowed testing, custom resolutions, anti-aliasing options, frame rate monitoring, and GPU temperature tracking. FurMark 1 includes support for GPU monitoring utilities such as GPU-Z and GPU Shark, preset benchmark profiles, screenshot capture, and multi-GPU configurations. It is frequently used to validate graphics card stability after driver updates, hardware upgrades, or overclocking adjustments. Features: • Intensive GPU stress testing and burn-in benchmarking • OpenGL-based rendering engine • Real-time GPU temperature monitoring • Fullscreen and windowed benchmark modes • Custom resolutions and anti-aliasing support • GPU stability and overheating detection • Preset benchmark profiles • Multi-GPU support • FPS monitoring and performance statistics • Screenshot capture support • GPU information support through GPU-Z and GPU Shark • Portable and installer versions available • Useful for overclock stability testing and thermal validation Supported operating systems: • Windows 7, Windows 8, Windows 10, Windows 11 Supported languages: • English Changes: v1.39.3.0 10-08-25 + added support of AMD Radeon RX 7700, Radeon RX 7400 and Radeon PRO W7400. + added support of NVIDIA GeForce RTX 5050, RTX PRO 5000 and RTX 5090 D v2. + added support of AMD Radeon RX 9060 XT, Radeon RX 9060, Radeon RX 9070 GRE, Radeon AI PRO R9700. + added logos in benchmark score box for Qualcomm and Moore Threads. ! updated: GPU Shark 0.33.3.0. ! updated: GPU-Z 2.68.0 ! updated: ZoomGPU 1.43.0 (32-bit GPU monitoring library) Click here ... |
|
8,306 | Jun 05, 2026 Geeks3D 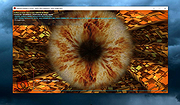 |
|
HDDScan v4.1 HDDScan v4.1 👉 Free hard drive and SSD diagnostic utility for testing storage devices, reading S.M.A.R.T. data, and monitoring drive health. HDDScan is a freeware diagnostic utility for hard drives, SSDs, RAID arrays, USB flash drives, and other supported storage devices. It can test drives for bad blocks and bad sectors, display and analyze S.M.A.R.T. attributes, run built-in S.M.A.R.T. tests, monitor drive temperature, display performance graphs during testing, generate identity reports, and adjust certain drive parameters such as AAM, APM, and PM. It also supports saving reports in MHT format, printing reports, and building command line tasks. Features: • Tests storage devices for bad blocks and bad sectors • Reads and analyzes S.M.A.R.T. attributes • Runs Short, Extended, and Conveyance S.M.A.R.T. tests • Monitors drive temperature • Supports verification, read, erase, and butterfly read tests • Displays performance graphs and response-time maps • Generates drive identity information reports • Supports AAM, APM, and power management controls on supported drives • Can start or stop spindle operation on supported drives • Saves reports in MHT format • Prints reports • Includes command line support • Supports IDE, SATA, SCSI, SAS, USB, FireWire, RAID volumes, flash drives, and supported SSDs Supported operating systems: • Windows XP SP3, Windows Server 2003, Windows Vista, Windows 7, Windows 8, Windows 10 Supported languages: • English Changes: v4.1 Features: Automatic Settings Preservation: Should help some drives "to remember" AAM/APM/PM setting after power cycle SMART Window will show "Drive State" at the top for easier "health" check Bugfixes: Command line "Administrator Permission" bugfix Click here to visit the author's website. |
|
770 | Apr 19, 2026 Artem Rubtsov 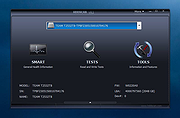 |
|
HWMonitor v1.68 HWMonitor v1.68 👉 Hardware monitoring tool that displays real-time system sensor data. HWMonitor is a hardware monitoring program that reads PC system health sensors to display voltages, temperatures, fan speeds, and power consumption in real time. It provides a clear and organized view of key hardware metrics gathered from onboard sensors, helping users monitor system stability and performance. HWMonitor supports a wide range of hardware including CPUs, GPUs, motherboards, and storage devices. It can read data from SMART-enabled hard drives, temperature sensors, and voltage rails, making it useful for diagnosing overheating issues or checking system performance under load. The interface is simple and lightweight, showing minimum, maximum, and current values for each sensor, allowing users to track changes over time without unnecessary clutter. Features: • Monitors temperatures, voltages, fan speeds, and power usage • Displays minimum, maximum, and current sensor values • Supports CPUs, GPUs, hard drives, and motherboards • Reads SMART data from storage devices • Lightweight and portable-friendly operation • Simple, easy-to-read interface Supported operating systems: • Windows XP, Windows Vista, Windows 7, Windows 8, Windows 10, Windows 11 Supported languages: English Changes: v1.68 09-14-26 PCI Express errors counters on AMD and Intel GPUs. New metrics on AMD Strix Point, Strix Halo and Kraken Point : NPU power, NPU clocks, NPU TOPS and TOPS per watt, NPU DRAM bandwidth usage, global platform power and DRAM read and write bandwidths. New HDD metrics (IOPS, average latency, NVMe controller link speed). Remembers devices & sensor types nodes state. This download is for the Windows x86/x64 version (very bottom of page). All other download assets are below: Other Windows: hwmonitor-arm64_1.05.zip Click here to visit the author's website. |
|
7,738 | Sep 16, 2026 CPUID 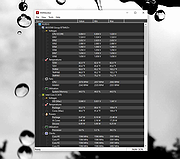 |
|
Temperature Icon Meter v2.4 Temperature Icon Meter v2.4 A small "notifyicon" system temperature meter for Windows. It displays small notifyicon which visualize the user selected current temperature readings in small bars. Also it will record the minimum and maximum temperature readings during its running. The temperature readings is collected via WMI interface provided by Open Hardware Monitor. Features: • Customizable bar colors for safe / warning / danger temperatures ranges. • Customizable temperature ranges (safe / warning / danger). • Customizable display names for any detected temperature sensors. • Use vertical or horizontal bars • Autostart when Windows start up • Display numerical readings in popup tooltip message when mouse cursor hovers over the meter Usage: • Left click the meter icon to show the popup window. • Right click the meter icon to access the setup dialog (setup menu item), or to close the program (Close menu item). • Select the check box of a temperature sensor to include it in the notifyicon and make it highlighted in the popup window. • Click the blue link to edit the display name of any temperature sensor, the display name will be shown in the popup tooltip and popup window. • Currently 4 languages (traditional Chinese, simplified Chinese, English and Japanese) are supported, you can select your desired language in the setup dialog. • All settings could be found in the setup dialog. Notes: • Temperature Icon Meter needs user to confirm the UAC (User Account Control) prompt during its first run, and it should start automatically without interruption next time if you enable the Run at Startup option. • Temperature Icon Meter ... |
|
1,038 | Mar 20, 2025 Oscar Kin-Chung Au 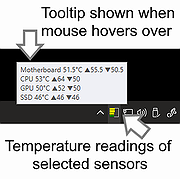 |
| Showing rows 1 to 11 of 11 | Showing Page 1 of 1 | 1 |
OlderGeeks.com Copyright (c) 2026
