|

|
Processed through Paypal No account required. |








Buy our over-priced crap to help pay the bills.



|
|
Processed through Paypal No account required. |
| Files | ||||
| File Name | Rating | Downloads | ||
 |
CoolerControl v4.3.1 CoolerControl v4.3.1 👉 Monitor and control cooling devices, fan curves, RGB lighting, and system temperatures on Linux. CoolerControl is a powerful Linux application for monitoring and managing your PC's cooling hardware from a single modern interface. It combines support for standard hardware monitoring with advanced fan and pump control, custom temperature sensors, RGB lighting management, dashboards, and automation profiles. CoolerControl works with many motherboard sensors, GPUs, AIO liquid coolers, and other supported devices through Linux hardware monitoring frameworks and supported back-end services. The application provides real-time monitoring of temperatures, fan speeds, pump speeds, voltages, utilization, and other hardware statistics while allowing you to create custom fan curves based on multiple temperature sources. Built-in dashboards, profiles, and automation make it easy to optimize cooling for quiet operation, gaming, or maximum performance. Features: • Monitor CPU, GPU, motherboard, storage, and other hardware sensors • Create custom fan and pump curves • Control supported RGB lighting devices • Build custom dashboards for system monitoring • Create and switch between cooling profiles and modes • Use multiple temperature sources for intelligent fan control • Support custom sensors and calculated values • View real-time graphs and historical statistics • Configure alerts and advanced device settings • Support supported liquid coolers, fan controllers, and motherboard sensors • Automatic detection of supported hardware • Modern desktop interface with dark theme support • Includes both desktop application and background daemon Supported operating systems: • Arch Linux • Debian 12 Bookworm or higher • Fedora • NixOS • openSUSE Tumbleweed • Ubuntu 22.04 or higher Supported languages: English Changes: v4.3.1 05-23-26 Added True Duty Mapping calibration for RPM-reporting fans and pumps. Added automatic kick-in boost detection during calibration with configurable behavior. Added disconnected fan and diagnostic reporting during calibration. Added calibration popover with duty-to-RPM relationship graph. Added reset button for Table View statistics. Added quick-menu links for creating Dashboards and Modes. Changed Table View statistics to span the full daemon runtime. Fixed Dashboard time axis display when changing filters in smaller windows. Installation: This download includes ... |
 |
1,225 | Jul 09, 2026 Guy Boldon 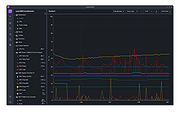 |
|
Core Temp v1.21 Core Temp v1.21 👉 Compact CPU monitoring utility for tracking processor temperatures, loads and other vital information. Core Temp is a small, lightweight processor monitoring utility designed to display the temperature of each individual CPU core in real time. It reads the Digital Thermal Sensors built into modern Intel, AMD and VIA x86 processors, providing accurate temperature information directly from the processor rather than relying on motherboard sensors. It can also display processor model information, frequencies, load levels, power-related data and minimum, maximum and average temperature readings. Core Temp offers customizable notification-area monitoring, logging, Mini-Mode and support for plug-ins that can extend its functionality. Features: • Monitors the temperature of individual CPU cores in real time • Reads temperatures directly from the processor's Digital Thermal Sensors • Supports Intel, AMD and VIA x86 processors • Displays processor identification and model information • Shows individual core load information • Displays processor frequency information • Tracks minimum, maximum and average temperature readings • Provides configurable notification-area sensor displays • Includes a battery status indicator for the notification area • Includes a compact Mini-Mode display • Adjustable user-interface zoom • Can log processor temperature and monitoring information • Supports multiple processors and multiple cores • Motherboard-independent temperature monitoring • Provides shared-memory data for other applications • Supports plug-ins and add-ons for expanded functionality • Lightweight design with a small system footprint Supported operating systems: • Windows XP, Windows 7, Windows 8, Windows 8.1, Windows 10, Windows 11 • Windows Server 2003, Windows Server 2008, Windows Server 2012, Windows Server 2016, Windows Server 2019, Windows Server 2022, Windows Server 2025 Supported languages: English, Abkhaz, Armenian, Bulgarian, Simplified Chinese, Traditional Chinese, Catalan, Czech, Danish, Dutch, Finnish, French, Galician, German, Greek, Hebrew, Hungarian, Italian, Japanese, Korean, Norwegian, Polish, Portuguese, Romanian, Russian, Slovak, Slovenian, Spanish, Swedish, Turkish, Ukrainian, Vietnamese Changes: v1.21 10-03-26 - New: Redesign the notification tray configuration dialog. Should now be more intuitive and flexible. - Fix: Notification tray icons issues; missing ... |
|
5,448 | Oct 14, 2026 Arthur Liberman 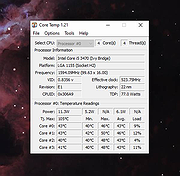 |
|
Fan Control v275 Fan Control v275 👉 Highly customizable fan control software for Windows. Fan Control is a focused and highly customizable fan controlling software for Windows that lets you control CPU, GPU, and case fans using temperature-based logic. It supports guided setup, multiple profiles, theme customization, multiple temperature sources, several fan curve functions including custom graphs, mixed fan curves and sensors using max, min, or average logic, low resource usage, and advanced tuning options such as steps, start and stop percentages, response time, and hysteresis. Features: • Guided setup process on first launch • Save, edit, and load multiple profiles • Change the theme and color of the application • Multiple temperature sources including CPU, GPU, motherboard, and hard drives • Multiple fan curve functions, including a custom graph • Mix fan curves or sensors together using max, min, or average • Low resource usage • Advanced tuning with steps, start %, stop %, response time, and hysteresis • Extensive support for CPU, GPU, case fans, and other hardware such as AIOs • Plugin support for adding third-party temperature, speed, or control sensors Fan curve types • Auto: PI-ish type function. % will surf until temp is stable at load. • Linear : Temperature based linear function • Graph : Temperature based custom curve • Target: Temperature based that holds speed until target temperature is reached • Mix : Use two different curves and apply a mix function (Min, Max, Sum, Average) • Sync : Sync to an existing control • Flat: Set a fixed % Graph fan curve editor • Change the temperature range for finer control ... |
|
7,184 | Aug 26, 2026 Rem0o 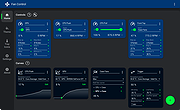 |
|
HWiNFO v8.54 HWiNFO v8.54 👉 Professional hardware information, real-time monitoring, and diagnostics for Windows and DOS systems. HWiNFO is a comprehensive hardware analysis, system information, diagnostics, and real-time monitoring utility designed for enthusiasts, technicians, and IT professionals. It provides detailed information about virtually every hardware component in your computer while continuously monitoring temperatures, voltages, fan speeds, power usage, clocks, storage health, and many other sensor values. HWiNFO also generates comprehensive hardware reports, supports extensive logging, and integrates with numerous third-party monitoring applications through its shared memory interface. Features: • In-depth hardware information with detailed analysis of system components • Real-time monitoring of CPUs, GPUs, mainboards, drives, and peripherals • System health monitoring designed to help detect overheating, overload, performance loss, or possible failure • Extensive reporting with full hardware hierarchy or quick summary overview • Export reports in XML, CSV, and HTML formats • Customizable monitoring tables, graphs, tray icons, and OSD • Customizable alerts on monitored parameters with user-defined actions • Support for interfacing with other applications and third-party extensions • Shared Memory interface support for exposing sensor data • Clean and secure design with no personal data collection and no network transmission • Frequently updated to support new hardware, technologies, and standards Supported operating systems: • Windows 95 and later (x86, x64 or ARM64) Supported languages: English, French, German, Spanish, Portuguese (Brazil), Italian, Dutch, Danish, Chinese (Simplified), Chinese (Traditional), Japanese, Korean, Vietnamese, Arabic, Russian, Ukrainian, Czech, Slovak, Hungarian, Polish, Swedish, Finnish, Norwegian, Greek, Turkish, Latvian, Hebrew Changes: v8.54 09-30-26 Added reporting of monitored process name to RTSS sensor title. Added workaround for NVML crash during GPU driver update. Fixed NZXT Kraken Elite V2 support. Fixed reporting of negative temperatures for NVIDIA GPU memory chips. Added ability to show multiple values on one line in OSD. Fixed reporting of PCH power on Intel Panther Lake and later. Added reporting of Fan Duty for Thermal Grizzly WireView Pro II. Added options to insert notes into json sensor log. Improved ... |
|
13,449 | Oct 02, 2026 REALiX 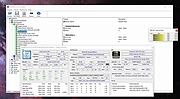 |
|
HWMonitor v1.68 HWMonitor v1.68 👉 Hardware monitoring tool that displays real-time system sensor data. HWMonitor is a hardware monitoring program that reads PC system health sensors to display voltages, temperatures, fan speeds, and power consumption in real time. It provides a clear and organized view of key hardware metrics gathered from onboard sensors, helping users monitor system stability and performance. HWMonitor supports a wide range of hardware including CPUs, GPUs, motherboards, and storage devices. It can read data from SMART-enabled hard drives, temperature sensors, and voltage rails, making it useful for diagnosing overheating issues or checking system performance under load. The interface is simple and lightweight, showing minimum, maximum, and current values for each sensor, allowing users to track changes over time without unnecessary clutter. Features: • Monitors temperatures, voltages, fan speeds, and power usage • Displays minimum, maximum, and current sensor values • Supports CPUs, GPUs, hard drives, and motherboards • Reads SMART data from storage devices • Lightweight and portable-friendly operation • Simple, easy-to-read interface Supported operating systems: • Windows XP, Windows Vista, Windows 7, Windows 8, Windows 10, Windows 11 Supported languages: English Changes: v1.68 09-14-26 PCI Express errors counters on AMD and Intel GPUs. New metrics on AMD Strix Point, Strix Halo and Kraken Point : NPU power, NPU clocks, NPU TOPS and TOPS per watt, NPU DRAM bandwidth usage, global platform power and DRAM read and write bandwidths. New HDD metrics (IOPS, average latency, NVMe controller link speed). Remembers devices & sensor types nodes state. This download is for the Windows x86/x64 version (very bottom of page). All other download assets are below: Other Windows: hwmonitor-arm64_1.05.zip Click here to visit the author's website. |
|
7,739 | Sep 16, 2026 CPUID 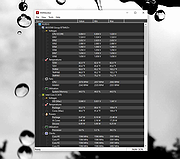 |
|
SIV (System Information Viewer) v5.88 SIV (System Information Viewer) v5.88 👉 Detailed Windows system, hardware, sensor, and network information utility. SIV (System Information Viewer) is a general Windows utility for displaying extensive system information, including CPU, PCI, PCMCIA, USB, SMBus, SPD, ACPI, machine, hardware sensor, network, and operating system details. It can also control certain AIO devices such as fans and LEDs by using the appropriate command-line option Features: • Displays detailed CPU information including processor type, features, clock speeds, and topology. • Reports motherboard, chipset, BIOS information, and firmware details. • Shows comprehensive PCI, PCIe, EISA, and PCMCIA device information. • Provides SMBus and SPD data including memory module information and sensor readings. • Displays detailed hardware sensor information including temperatures, voltages, and fan speeds. • Reports GPU information including PCIe link speed and lane configuration. • Shows USB device information and connected hardware details. • Displays ACPI information and power management related system data. • Provides detailed operating system information including installed updates and system configuration. • Shows network adapter information, IP configuration, and network statistics. • Supports viewing hardware I/O ports and device resource allocations. • Includes tools to view ghost devices and hidden hardware entries in the system. • Can generate and save detailed system reports for diagnostics or troubleshooting. • Allows optional control of supported AIO devices such as fans and LEDs via command-line options. • Designed to work across both modern and legacy Windows systems, including classic Windows 9x platforms. Supported operating systems: • Windows 11, Windows 10, Windows 8.1, Windows 8, Windows 7, Windows Vista, Windows XP, Windows Server 2022, Windows Server 2019, Windows Server 2016, Windows Server 2012, Windows Server 2008, Windows Server 2003, Windows 2000, Windows NT 4.0, Windows NT 3.51, Windows 95, Windows 98, Windows Me Supported languages: • English, Chinese (Simplified), Chinese (Traditional), Russian, Greek Changes: v5.88 10-14-26 Added GUID Class Names to [Lookup] (Menu->Help->SIV Lookup) and enable [WEB UPD] when later files are available. Added ASRock A520M-HVS ... |
|
20,337 | Oct 15, 2026 Ray Hinchliffe 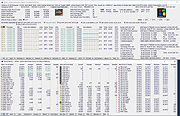 |
| Showing rows 1 to 6 of 6 | Showing Page 1 of 1 | 1 |
OlderGeeks.com Copyright (c) 2026
