|

|
Processed through Paypal No account required. |








Buy our over-priced crap to help pay the bills.



|
|
Processed through Paypal No account required. |
| Files | ||||
| File Name | Rating | Downloads | ||
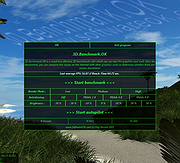 |
3D.Benchmark.OK v2.33 3D.Benchmark.OK v2.33 A small, free 3D benchmark for Windows. Features • Quick start and detection of the hardware • Changeable benchmark level • Adjustable anti-aliasing • Wind, water, light refraction, reflection, ... • 3D Bench Marks OK comparison on the Internet • Autopilot Demo (endless loop) Influence Autopilot with mouse or keyboard • Low CPU and RAM utilization • From: 256 MB graphics card / 1 GB Ram / OpenGL 2.1 Changes: v2.33 // 20 January 2025 • General adjustments in the 3D.Benchmark.OK application to the latest Windows 11 update. • The language file has been updated and the necessary adjustments made. • New language: Persian • Many thanks to DJ Iran for the Persian language. This download is for the Windows 64bit version (very bottom of page). If you need the Windows 32bit version, download here. Click here to visit the author's website. |
 |
3,795 | Jan 22, 2025 Nenad Hrg |
 |
Blender Benchmark v3.3.0 Blender Benchmark v3.3.0 👉 Benchmark your CPU and GPU performance using official Blender rendering workloads. Blender Benchmark is the official benchmarking utility from the Blender Foundation for measuring CPU and GPU rendering performance using real Blender scenes. It allows you to compare your system against hundreds of thousands of publicly submitted benchmark results through the Blender Open Data platform. The benchmark supports multiple Blender versions and render backends, making it useful for evaluating hardware upgrades, testing system stability, comparing driver performance, and validating overclocking results. Anonymous benchmark submissions help improve Blender development while giving users a reliable way to compare performance across a wide variety of hardware configurations. Features: • Official benchmark from the Blender Foundation. • Tests CPU and GPU rendering performance using real Blender scenes. • Supports multiple Blender versions for comparison testing. • Choose individual benchmark scenes or run the complete suite. • Supports CPU and GPU render devices where available. • Measures performance using Blender's Cycles rendering engine. • Upload benchmark results anonymously to Blender Open Data. • Compare results with hundreds of thousands of publicly submitted systems. • View detailed hardware rankings and performance statistics online. • Can be run offline using downloadable benchmark scripts and scenes. • Uses only free and open source software with public-domain benchmark content. Supported operating systems: • Windows 7, Windows 8, Windows 10, Windows 11 • macOS • Linux Supported languages: • English Changes: v3.3.0 03-10-26 Support for the latest Intel GPUs has been added using oneAPI. This download is for the Windows version (very bottom of page). All other download assets are below: Other Windows: benchmark-launcher-cli-3.3.0-windows.zip (Command Line Interface) macOS: benchmark-launcher-3.3.0-macos.dmg benchmark-launcher-cli-3.3.0-macos.zip (Command Line Interface) Linux: benchmark-launcher-3.3.0-linux.tar.gz benchmark-launcher-cli-3.3.0-linux.tar.gz (Command Line Interface) Click here to visit the author's website. |
|
3,368 | Jun 18, 2026 Blender Foundation |
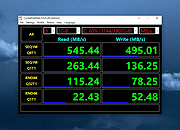 |
CrystalDiskMark v9.0.3 CrystalDiskMark v9.0.3 👉 Simple and reliable disk benchmark software. CrystalDiskMark is a lightweight disk benchmark utility designed to quickly measure the sequential and random read and write performance of hard drives, SSDs, NVMe drives, USB flash drives, and other storage devices. It provides clear and easy to understand results, making it ideal for comparing drive speeds or verifying storage performance after installation or upgrades. CrystalDiskMark supports multiple test modes and customizable settings, allowing users to adjust test size, number of passes, and measurement units. The interface is straightforward, with large buttons and clear output columns for sequential and random read and write speeds. It is widely used by enthusiasts, reviewers, and everyday users who want accurate storage performance results without unnecessary complexity. Features: • Measures sequential and random read and write performance • Supports HDD, SSD, NVMe, and USB storage devices • Multiple test sizes and pass counts • Customizable test profiles and settings • Displays results in MB/s, IOPS, and latency • Simple and easy to use interface Supported operating systems: • Windows 8.1, Windows 10, Windows 11 Supported languages: English, Japanese, Chinese (Simplified), Chinese (Traditional), Korean, French, German, Italian, Spanish, Portuguese, Russian, Polish, Hungarian Changes: v9.0.3 05-24-26 Improved: Security of DLL loading process Click here to visit the author's website. |
|
6,721 | Jun 27, 2026 Crystal Dew World |
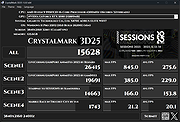 |
CrystalMark 3D25 v1.0.0 CrystalMark 3D25 v1.0.0 A 3D bench-marking software that allows you to easily measure 3D performance (GLSL/WebGL) with a single click. CrystalMark 3D25 was developed with the goal of showcasing the appeal of the demo scene to PC enthusiasts (bench-markers) worldwide, featuring works provided by demo scene creators who support Japan’s demo scene. Supported operating systems: Windows 10/11 Featured Demos: LiveCoding@AirPort AnimeFes 2023 by Renard LiveCoding@AirPort AnimeFes 2023 by gam0022 Stairway to SESSIONS by Kamoshika Marble Race in Truchet City by yue How to use: Benchmark Click the “All” button to run the Scene1-4 benchmarks in order. Clicking the “Scene1,” “Scene2”, “Scene3” and “Scene4” buttons will run the benchmarks individually. Submission to CrystalMarkDB Click “Submit” button to go to the registration page to CrystalMarkDB via web browser. Click “QR” button to display QR code for data registration to CrystalMarkDB. Please read it with the camera of your smartphone or tablet. Post to X (Twitter) Clicking on the “X” button will take you to a screen for posting to X via a web browser. Please attach screenshot of CrystalMark Retro manually. GPU Selection Multiple GPUs may be displayed. You can choose one from several GPUs. However, you do not have the ability to choose which GPU to use for benchmarks. This download is for the Windows portable version (very bottom of page). If you need the Windows installer version, download here. Click here to visit the author's website. |
|
706 | Nov 24, 2025 Crystal Dew World |
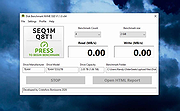 |
Disk Benchmark NVME SSD v1.1.0 Disk Benchmark NVME SSD v1.1.0 👉 A free portable tool for benchmarking storage read and write performance directly inside any selected folder. Disk Benchmark NVME SSD is a free, portable Windows benchmarking utility designed to measure sequential read and write performance using the actual folder where your files are stored. Rather than requiring you to select a physical drive, it lets you choose a specific folder or path and tests storage performance there. This makes it useful for testing NVMe and SATA SSDs, hard drives, USB storage and compatible network paths. The program performs a focused SEQ1M Q8T1 sequential benchmark using 1 MiB operations, allows you to configure the number of passes and test size, and generates an HTML report containing system, path and performance information. Temporary benchmark data is automatically removed when testing is complete, with cleanup handling included for interrupted sessions. It requires no installation and can be run directly as a portable application. Features: • Measures sequential read and write storage performance • Uses 1 MiB sequential operations • Focused SEQ1M Q8T1 benchmark • Tests a selected folder or path rather than requiring physical drive selection • Configurable benchmark pass count • Configurable test size • Displays read results and benchmark progress while testing • Reports the best completed benchmark result • Generates an HTML report after each completed test • Reports path, system and performance information • Works with NVMe SSDs, SATA SSDs, hard drives and USB storage • Can benchmark compatible network paths • Automatically removes temporary test data after completion • Includes recovery cleanup for interrupted benchmark sessions • Completely portable with no installation required Supported operating systems: • Windows 10, Windows 11 Supported languages: English Changes: v1.1.0 08-23-26 Not provided. Note: This file has one hit on VirusTotal. We have confirmed this to be a false positive. The file is safe. Click here to visit the author's website. |
|
212 | Aug 23, 2026 Cristoforo Bonissone |
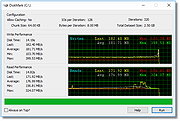 |
DiskMark v1.0.0.8 32bit DiskMark v1.0.0.8 32bit DiskMark is a small utility that allows you to benchmark your disks and hard drives performance. It allows you to specify many advanced options to determine how your drives perform best and to determine the typical operating performance. Release Notes Changed a lot of terminology, updated documentation. |
|
5,852 | Nov 19, 2019 NetworkDLS |
|
DiskMark v1.0.0.8 64bit DiskMark v1.0.0.8 64bit DiskMark is a small utility that allows you to benchmark your disks and hard drives performance. It allows you to specify many advanced options to determine how your drives perform best and to determine the typical operating performance. Release Notes Changed a lot of terminology, updated documentation. |
|
5,929 | Nov 19, 2019 NetworkDLS |
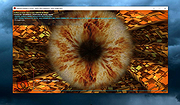 |
FurMark 1 v1.39.3.0 FurMark 1 v1.39.3.0 Advanced GPU stress testing and graphics benchmarking utility. FurMark 1 is a powerful OpenGL-based GPU stress testing and benchmarking application designed to push graphics cards to their thermal and performance limits. Commonly used by enthusiasts, overclockers, and technicians, FurMark helps evaluate graphics card stability, cooling efficiency, and overall performance under extreme load conditions. FurMark 1 uses an intensive fur rendering engine that heavily loads the GPU, making it useful for detecting overheating issues, cooling problems, instability, graphical artifacts, or power delivery limitations. The application also provides benchmarking modes, fullscreen and windowed testing, custom resolutions, anti-aliasing options, frame rate monitoring, and GPU temperature tracking. FurMark 1 includes support for GPU monitoring utilities such as GPU-Z and GPU Shark, preset benchmark profiles, screenshot capture, and multi-GPU configurations. It is frequently used to validate graphics card stability after driver updates, hardware upgrades, or overclocking adjustments. Features: • Intensive GPU stress testing and burn-in benchmarking • OpenGL-based rendering engine • Real-time GPU temperature monitoring • Fullscreen and windowed benchmark modes • Custom resolutions and anti-aliasing support • GPU stability and overheating detection • Preset benchmark profiles • Multi-GPU support • FPS monitoring and performance statistics • Screenshot capture support • GPU information support through GPU-Z and GPU Shark • Portable and installer versions available • Useful for overclock stability testing and thermal validation Supported operating systems: • Windows 7, Windows 8, Windows 10, Windows 11 Supported languages: • English Changes: v1.39.3.0 10-08-25 + added support of AMD Radeon RX 7700, Radeon RX 7400 and Radeon PRO W7400. + added support of NVIDIA GeForce RTX 5050, RTX PRO 5000 and RTX 5090 D v2. + added support of AMD Radeon RX 9060 XT, Radeon RX 9060, Radeon RX 9070 GRE, Radeon AI PRO R9700. + added logos in benchmark score box for Qualcomm and Moore Threads. ! updated: GPU Shark 0.33.3.0. ! updated: GPU-Z 2.68.0 ! updated: ZoomGPU 1.43.0 (32-bit GPU monitoring library) Click here ... |
|
8,305 | Jun 05, 2026 Geeks3D |
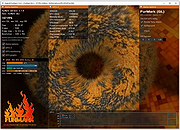 |
FurMark 2 v2.10.2 FurMark 2 v2.10.2 OpenGL and Vulkan GPU stress test and graphics benchmark. FurMark 2 is the next-generation edition of the legendary GPU stress testing and benchmarking utility from Geeks3D. Designed for gamers, overclockers, system builders and hardware enthusiasts, FurMark 2 pushes graphics cards to their thermal and performance limits using demanding OpenGL and Vulkan rendering workloads. It is commonly used to test cooling performance, verify GPU stability, identify overheating issues, detect graphical artifacts, and benchmark overall graphics performance. Unlike the original FurMark 1, FurMark 2 introduces a redesigned engine with modern rendering technologies, Vulkan support, improved compatibility with current GPUs, and enhanced benchmarking capabilities. The software can run intensive fullscreen or windowed stress tests while displaying real-time GPU information including temperatures, clocks, usage, fan speeds, and performance statistics. FurMark 2 also includes benchmark presets for quick comparisons, customizable testing modes, anti-aliasing options, artifact scanning, and command-line support for automation and advanced diagnostics. Whether you are validating a fresh GPU installation, testing overclock stability, troubleshooting crashes, or simply comparing benchmark scores with other systems online, FurMark 2 provides a fast and reliable solution for GPU performance analysis. Features: • Advanced OpenGL and Vulkan GPU stress testing • Designed to heavily load GPUs for thermal and stability testing • Modern rendering engine optimized for current graphics hardware • Built-in benchmark presets for quick performance comparisons • Custom benchmark modes with adjustable resolution and anti-aliasing • Real-time GPU monitoring during testing sessions • Displays GPU temperature, clocks, fan speed, usage and performance data • Artifact scanner helps detect rendering errors and unstable overclocks • Supports fullscreen and windowed testing modes • Online benchmark score submission and comparison support • Useful for validating overclocking and cooling system performance • Command-line options for scripting and automated testing • Compatible with many NVIDIA, AMD and Intel graphics cards • Includes GPU information and hardware identification tools • Lightweight interface with quick access to common ... |
|
2,154 | Jun 05, 2026 Geeks3D |
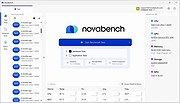 |
Novabench v6.0.3 Novabench v6.0.3 👉 Free PC benchmarking and hardware performance testing utility. Novabench is a free benchmarking program that allows you to quickly test and evaluate your computer’s overall performance. It measures CPU, GPU, RAM, and storage speeds using a simple interface designed for both casual users and technicians. The free version provides a complete system benchmark score along with detailed hardware information and comparison tools to help identify performance bottlenecks or hardware problems. Novabench can be useful for checking system stability after upgrades, comparing hardware performance against similar systems, troubleshooting slow computers, and monitoring the effects of overclocking or driver updates. Benchmark results can also be uploaded online to compare your PC with other systems using the Novabench database. Features: • Free CPU, GPU, RAM, and disk benchmarking • Generates an overall system performance score • Quick benchmark testing with minimal setup required • Displays detailed hardware and system information • Compare benchmark results with other systems online • Useful for testing gaming PCs, laptops, and workstations • Helps identify hardware bottlenecks and slow components • Portable benchmark results that can be shared online • Lightweight interface suitable for beginners and technicians • Supports stress testing and stability verification tools • Includes temperature and hardware monitoring support • Can help verify system improvements after upgrades or repairs Supported operating systems: • Windows 10, Windows 11 • macOS 11 Big Sur or higher • Linux distributions supporting modern x86-64 hardware Supported languages: • English Changes: v6.0.3 06-09-26 • Improved benchmark reliability and scoring consistency • Updated hardware detection and compatibility support • General bug fixes and stability improvements This download is for the Windows installer version (very bottom of page). All other download assets are below: Other Windows: novabench-arm64.exe macOS: novabench.dmg Linux: novabench-x64.deb novabench-arm64.deb novabench-x64.rpm novabench-arm64.rpm Click here to visit the author's website. |
|
7,802 | Jun 09, 2026 Novawave Inc. |
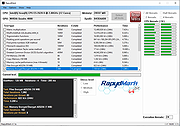 |
RapydMark v1.2a RapydMark v1.2a A portable computer benchmarking tool for Windows. It determines the performance of a computer's 3D graphic rendering and CPU workload parallel processing capabilities. No installation, unzip and run. MAIN FEATURES MULTIPLE TESTS 22 different tests, including one test in 3D. Tests measure single-thread performance of CPU and multi-threads. 64 AND 32 BITS RapydMark application in two versions, 64 bits and 32 bits for Windows 11, Windows 10 and Windows 7. SUBMIT REPORTS You can submit your results reports to a cloud database for comparison with other reports from other users. SAVE REPORTS Allows to save the results reports to disk in plain text files for later study or to send by email. How to use this program ----------------------- - RapydMark.exe is the executable for 32 bits systems and RapydMark_x64.exe for 64 bits systems. - The 'Performance' column shows iterations per second, test performance. Also shows the threads used for the test (4th = four threads). - 'Memory cache performance' test only works with 4 threads maximum, because too many threads would use too much memory. In this test what is relevant is not the result shown in 'Performance', the true results are the processing times of each memory block. - GFLOPS results are not comparable with the GFLOPS of the CPU specifications. Only comparable with the results of this test. - The clock speed (GHZ) of the CPU description might not show the Turbo Boost speed. - In all tests, except for 'Memory cache performance', the iterations are divided among the execution threads. - Before run tests close all applications on your system for reliable results. Stress Levels: -------------- - Low stress level is the best for single-thread performance tests (all computers) or for multi-threads tests for low-performance computers. - Medium stress level is the best for medium/high performance computers. - High stress level it's only recommended for very high performance computers. Changes: v1.2a - September 19, 2021: - Add TOTAL TIME - Add more information in Operating ... |
|
4,369 | Oct 27, 2021 Jordi Pιrez |
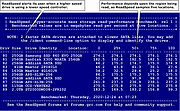 |
ReadSpeed v1.0.7664.1 ReadSpeed v1.0.7664.1 GRC's Hyper-accurate mass storage read-performance benchmark What you discover is going to surprise you. ReadSpeed is the most accurate benchmark of PC mass storage ever created. It has measurement stability and repeatability of greater than 4 significant digits – better than 1 part in 10,000, or 0.01%. After you use ReadSpeed on your own system, you may have questions such as: Why is the end of my spinning hard drive half the speed of the front? Why does the end of my SMR-formatted drive show impossibly high performance? Why is the front of my SSD so much slower than the rest and why are there places where it virtually stalls? Are these problems? Should I worry? Is it possible to fix these things? GRC provides public web forums to provide answers to all of the questions you are going to have. And it's a place to ask questions that haven't yet been answered. It is a community which includes many of the people who helped develop and test ReadSpeed. So, they are knowledgeable and experienced users. The forums will help you create a bootable ReadSpeed USB thumb drive, boot it on most PCs, run ReadSpeed, and put its results into context. And you will be able to compare your results with everyone else's. As you can see in ReadSpeed's output above: Drive 80 is a high-quality 250GB Samsung 860 EVO SSD. Look at the five regional performance measurements shown. Every one of them is exactly 274.1 megabytes/second, plus or minus zero! This is at least four decimal digits of benchmark accuracy. Drive 81, the SanDisk X300 256GB MSATA, is almost as stable. It is slower and its performance is a bit less rock solid, but even so, each of the five regions is either 182.5 or ... |
|
3,152 | Apr 15, 2022 Gibson Research Corporation |
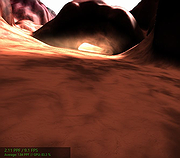 |
StressTheGPU v1.31 StressTheGPU v1.31 A simple and portable tool for stressing and maxing out your graphics cards. With customizable render scenes and an optional benchmark, it helps evaluate your GPU's performance and compare it against others. Features • Stress test for all GPUs • Suitable for both new and older graphics cards • Customizable render scenes: - The Desert Lives - The Ocean - A Lot of Grass - Lost on Mars • Extremely lightweight software • Compare performance with other GPUs • Portable usage • Multilingual user interface Supported operating systems: Windows 11, 10, 8.1, 7, Server 2012-2025, 2022. Changes: v1.31 // 16 August 2025 • Minor adjustments and improvements to the Stress The GPU app for Windows. • Necessary adjustments and language file updates. This download is for the 64bit version (very bottom of page). If you need the 32bit version, download here. Click here to visit the author's website. |
|
1,036 | Aug 17, 2025 Nenad Hrg |
 |
Tyler's Frame Machine v1.0 Tyler's Frame Machine v1.0 Tyler's Frame Machine saves the day by giving you a portable, efficient, small, easy to use, cross platform executable that you can use to benchmark or stress test anything… and charges you nothing for it. If you’re a frequent benchmarker, hardware tester, or system builder, TFM is your new best friend. It can demonstrate differences between framerates, stress test machines, and even help you calibrate for live streams. Features include physics objects, spawn rate control, gravity control, resolution selection, windowed mode control, physics framerate capping, global FPS capping, camera movement speed, and more. There’s no huge installer, no annoying splash sceen, and no crazy list of configurations to get through. It just opens and starts to run - you can change everything in realtime! This download is for the Windows version. If you need the MacOS version, download here. If you need the Linux version, download here. </source> Click here to visit the author's website. |
|
4,134 | Aug 06, 2024 Han Tylemagne |
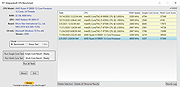 |
Wagnardsoft CPU Benchmark v1.1.0.0 Wagnardsoft CPU Benchmark v1.1.0.0 A really simple tool for benchmarking and comparing CPUs. Mostly using integer for benchmarking. Requirement: -Windows 7 SP1+ -Microsoft .NET Desktop Runtime 5+ ChangeLog (1.1.0.0): -misc. bug fix -added timer / info about rime remaining in stress test mode -added tooltip with mouser over result for more information SHA1: 22E9FC1087D99637D48C649852CBD3457679357F Click here to visit the author's website. |
|
3,636 | Jun 07, 2021 Wagnardsoft |
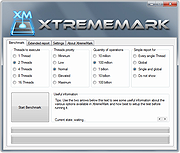 |
XtremeMark v5.6.2.420 XtremeMark v5.6.2.420 In some situations it can be useful, even just out for mere curiosity, to know more about your computer’s performance or that of a single component: to this end it is usually necessary to run a specific software program known as a "benchmark". XtremeMark is a software of this kind and it will test the speed of your PC and in particular that of your CPU (Central Processing Unit) by executing a large amount of parallel calculations and so on. The new version of XtremeMark can put both older and newer CPUs to the test; it supports 32/64bit processors, multicore and multi-thread (max 16 cores or parallel threads) machines. The strong point of XtremeMark is in its wide range of customization options: you can set how many threads to use for the test, how many calculations to carry out (from 10 million to 100 billion) and the priority level for calculations. Once a test has been performed, XtremeMark compiles a brief report which contains precise info about the computer and test results (the results are also exportable as TXT or RTF format files, thus it'll be easier to save them or share them on the Net, in forums, websites, via mail or even in a chatroom). XtremeMark can be easily updated online and is available both in English and Italian. Notes The results may slightly vary depending on the status of your system. For the best results be sure that every unnecessary application is closed, that there are no video or audio playback active, that there are no application using the internet connection, that there are no file being transferred or copied and that the operating system or any other application (like an antivirus software) is updating or scanning the system. New in version 5.6.2: Compatibility update. ... |
|
7,223 | Sep 27, 2019 Xtreme-LAb |
| Showing rows 1 to 16 of 16 | Showing Page 1 of 1 | 1 |
OlderGeeks.com Copyright (c) 2026
