|

|
Processed through Paypal No account required. |








Buy our over-priced crap to help pay the bills.



|
|
Processed through Paypal No account required. |
| Files | ||||
| File Name | Rating | Downloads | ||
 |
AllThreadsView v1.00 AllThreadsView v1.00 👉 View all running Windows threads from every process in one table. AllThreadsView is a lightweight portable utility from NirSoft that displays every running thread from every active process on your Windows computer in a single, continuously updated list. Instead of examining one process at a time, you can instantly see detailed information for all system and application threads, making it much easier to troubleshoot performance problems, investigate application behavior, or inspect low-level process activity. Features: • Displays all running threads from every active process • Shows Thread ID, Process ID, Process Name and Process Path • Displays thread creation time, duration, kernel time and user time • Shows thread priority, base priority and wait reason • Displays the thread start address • Automatically refreshes the thread list • Option to display only active threads • Export selected or all items to TXT, CSV, HTML, XML and JSON • Portable application requiring no installation Supported operating systems: • Windows XP, Windows Vista, Windows 7, Windows 8, Windows 10 • Windows 11 • 32-bit and 64-bit editions Supported languages: English, Arabic, Basque, Bulgarian, Catalan, Czech, Danish, Dutch, Finnish, French, German, Greek, Hungarian, Italian, Japanese, Korean, Persian, Polish, Portuguese, Portuguese (Brazil), Romanian, Russian, Simplified Chinese, Slovak, Slovenian, Spanish, Swedish, Traditional Chinese, Turkish, Ukrainian Changes: v1.00 06-28-26 • First release. This download is for the Windows 64bit version (very bottom of page). If you need the Windows 32bit version, download here. Click here to visit the author's website. |
 |
4,620 | Jun 29, 2026 Nir Sofer 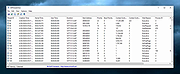 |
 |
AMD Ryzen Master v3.1.1.5502 AMD Ryzen Master v3.1.1.5502 👉 Unlock, monitor, and tune AMD Ryzen processor performance. AMD Ryzen Master is AMD's official utility for controlling and monitoring supported AMD Ryzen processors. It provides access to overclocking, system telemetry, automatic tuning, performance profiles, CPU and RAM views, integrated Radeon graphics tuning, PBO and Curve Optimizer settings, and real-time monitoring for clock rates, temperatures, and voltages. Features: • Official AMD utility for supported Ryzen processors • Redesigned interface for essential controls and telemetry • Basic and Advanced modes • Automatic CPU and RAM overclocking • Real-time per-core clock monitoring • Temperature and voltage monitoring • Average and peak readings • Custom monitoring views • Multiple performance profiles • Tune Ryzen CPU settings • Adjust integrated Radeon graphics frequency • Adjust DDR5 memory timings • Workspace for immediate tuning adjustments • Integrated Radeon graphics overclocking on supported processors • PBO and Curve Optimizer adjustment options • CPU CCD monitoring views • RAM views focused on EXPO parameters Supported operating systems: • Windows 10 64-bit, Windows 11 64-bit Supported languages: English, German, French, Simplified Chinese Changes: v3.1.1.5502 07-22-26 Release Highlights Added support for the Curve Shaper feature – a fine‑grain voltage/frequency tuning capability that allows selective voltage adjustments across temperature and frequency bands; applicable to the AMD Ryzen™ 9000 Series. Known Issues The application may take a bit longer to load on systems with higher core count CPUs In certain scenarios, when Ryzen Master is launched from AMD Software: Adrenalin Edition™, Ryzen Master Dashboard may not display accurate metric values. As a workaround, restart your system, and then launch Ryzen Master before starting AMD Software: Adrenalin Edition™. This download is for the Ryzen 5000 Series processors and later version (very bottom of page). All other download assets are below: For Ryzen 3000 Series to 4000 Series processors version: amd_ryzen_master_2.14.3.5040.exe For Ryzen 2000 Series processors and earlier version: amd-ryzen-master-2-13-1-3097.exe Click here to visit the author's website. |
|
24,023 | Sep 16, 2026 Advanced Micro Devices, Inc 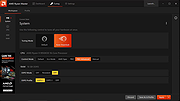 |
|
BES – Battle Encoder Shirasι v1.8.0.39 BES – Battle Encoder Shirasι v1.8.0.39 👉 Limit CPU usage of individual processes to improve system responsiveness and reduce game stuttering. BES – Battle Encoder Shirasι is a lightweight, portable open-source utility that allows you to throttle the CPU usage of individual processes. Instead of allowing a program to consume 100% of your processor time, BES can reduce its CPU usage to a user-defined percentage, making it easier to use other applications while demanding tasks continue running in the background. Originally created as a simple CPU-limiting tool, BES has become popular with gamers and power users for reducing stuttering, preventing certain games from monopolizing CPU resources, and improving responsiveness on older or lower-core-count systems. It requires no installation, stores its settings locally, and can be run directly from any folder or USB drive. Features: • Limit CPU usage for individual processes • Adjustable throttling percentage • Portable with no installation required • Monitor and manage multiple target processes • Watch processes and automatically reapply limits • Command-line support for automation • Optional background image customization • Low resource usage • Open source under the GNU GPL v2 license • Useful for reducing game stutters and improving multitasking Supported operating systems: • Windows XP, Windows Vista, Windows 7, Windows 8, Windows 8.1, Windows 10, Windows 11 Supported languages: • English, French, Japanese, Finnish, Chinese, Russian, German Changes: v1.8.0.39 03-30-25 • Increased the maximum number of watched targets from 8 to 32. Click here to visit the author's website. |
|
4,953 | Jun 26, 2026 mion 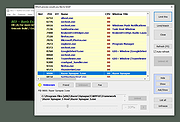 |
|
Blender Benchmark v3.3.0 Blender Benchmark v3.3.0 👉 Benchmark your CPU and GPU performance using official Blender rendering workloads. Blender Benchmark is the official benchmarking utility from the Blender Foundation for measuring CPU and GPU rendering performance using real Blender scenes. It allows you to compare your system against hundreds of thousands of publicly submitted benchmark results through the Blender Open Data platform. The benchmark supports multiple Blender versions and render backends, making it useful for evaluating hardware upgrades, testing system stability, comparing driver performance, and validating overclocking results. Anonymous benchmark submissions help improve Blender development while giving users a reliable way to compare performance across a wide variety of hardware configurations. Features: • Official benchmark from the Blender Foundation. • Tests CPU and GPU rendering performance using real Blender scenes. • Supports multiple Blender versions for comparison testing. • Choose individual benchmark scenes or run the complete suite. • Supports CPU and GPU render devices where available. • Measures performance using Blender's Cycles rendering engine. • Upload benchmark results anonymously to Blender Open Data. • Compare results with hundreds of thousands of publicly submitted systems. • View detailed hardware rankings and performance statistics online. • Can be run offline using downloadable benchmark scripts and scenes. • Uses only free and open source software with public-domain benchmark content. Supported operating systems: • Windows 7, Windows 8, Windows 10, Windows 11 • macOS • Linux Supported languages: • English Changes: v3.3.0 03-10-26 Support for the latest Intel GPUs has been added using oneAPI. This download is for the Windows version (very bottom of page). All other download assets are below: Other Windows: benchmark-launcher-cli-3.3.0-windows.zip (Command Line Interface) macOS: benchmark-launcher-3.3.0-macos.dmg benchmark-launcher-cli-3.3.0-macos.zip (Command Line Interface) Linux: benchmark-launcher-3.3.0-linux.tar.gz benchmark-launcher-cli-3.3.0-linux.tar.gz (Command Line Interface) Click here to visit the author's website. |
|
3,369 | Jun 18, 2026 Blender Foundation  |
|
Core Temp v1.21 Core Temp v1.21 👉 Compact CPU monitoring utility for tracking processor temperatures, loads and other vital information. Core Temp is a small, lightweight processor monitoring utility designed to display the temperature of each individual CPU core in real time. It reads the Digital Thermal Sensors built into modern Intel, AMD and VIA x86 processors, providing accurate temperature information directly from the processor rather than relying on motherboard sensors. It can also display processor model information, frequencies, load levels, power-related data and minimum, maximum and average temperature readings. Core Temp offers customizable notification-area monitoring, logging, Mini-Mode and support for plug-ins that can extend its functionality. Features: • Monitors the temperature of individual CPU cores in real time • Reads temperatures directly from the processor's Digital Thermal Sensors • Supports Intel, AMD and VIA x86 processors • Displays processor identification and model information • Shows individual core load information • Displays processor frequency information • Tracks minimum, maximum and average temperature readings • Provides configurable notification-area sensor displays • Includes a battery status indicator for the notification area • Includes a compact Mini-Mode display • Adjustable user-interface zoom • Can log processor temperature and monitoring information • Supports multiple processors and multiple cores • Motherboard-independent temperature monitoring • Provides shared-memory data for other applications • Supports plug-ins and add-ons for expanded functionality • Lightweight design with a small system footprint Supported operating systems: • Windows XP, Windows 7, Windows 8, Windows 8.1, Windows 10, Windows 11 • Windows Server 2003, Windows Server 2008, Windows Server 2012, Windows Server 2016, Windows Server 2019, Windows Server 2022, Windows Server 2025 Supported languages: English, Abkhaz, Armenian, Bulgarian, Simplified Chinese, Traditional Chinese, Catalan, Czech, Danish, Dutch, Finnish, French, Galician, German, Greek, Hebrew, Hungarian, Italian, Japanese, Korean, Norwegian, Polish, Portuguese, Romanian, Russian, Slovak, Slovenian, Spanish, Swedish, Turkish, Ukrainian, Vietnamese Changes: v1.21 10-03-26 - New: Redesign the notification tray configuration dialog. Should now be more intuitive and flexible. - Fix: Notification tray icons issues; missing ... |
|
5,446 | Oct 14, 2026 Arthur Liberman 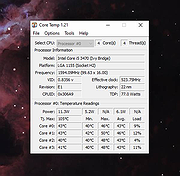 |
|
CPU Core Overload v2.3 CPU Core Overload v2.3 CPU Overload will make the specified core of your CPU to work at maximum speed. This can have multiple purposes: stress test of your CPU, thermal overload, stability test, miscellaneous system and programming tests. This app is completely portable and can be ran from a USB stick, network folder or cloud folder. |
|
4,864 | Oct 08, 2019 Cubic Design 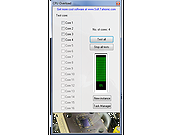 |
|
CPU Temp v1.3.1.0 CPU Temp v1.3.1.0 A free CPU temperature monitor for Windows. CPU Temp is a free and simple application for CPU Temperature monitoring, compatible with Windows 11 or earlier versions of Windows OS. CPU Temp seamlessly integrates, giving you real-time insights into your CPU's temperature, utilization, clock speed, power consumption, and other essential parameters of your processor. With its intuitive and customizable interface, CPU Temp presents a choice of over 40 different UI themes and color palettes. You can choose and select select UI appearance that resonates with your style, ensuring a tailored and immersive monitoring experience. CPU Temp Application Features CPU Temp uses a clear and intuitive interface to deliver an easy to use solution for CPU temp check, as well as other important CPU metrics. To the left, users will find a navigation bar split into distinct menu items, each correlating to specific functionalities within the application. Home view This is the main view of the CPU Temp Monitor application, and has the following items: • Vertical Tile Items: Located on the left, these tiles provide quick access to various CPU parameters. • Application Chart: Positioned at the center, chart control provides real-time statistics for the indicator represented by the tile item. • CPU Information section: Find a summary of important CPU information at the bottom of the home screen • Thermal Indicator: Conveniently situated next to the app header, this component offers a rapid glance at current thermal states for the CPU. Monitor view Shows detailed information about CPU other hardware sensors such as CPU and GPU temperature, load, clock and others. This information will provide you with comprehensive, real-time insights into PC hardware data. CPU Data Charts view This control offers a detailed view for CPU data. Depending on your platform, ... |
|
1,774 | Nov 15, 2023 CoderBag 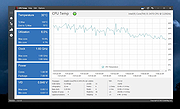 |
|
CPUSetter v1.7.1 CPUSetter v1.7.1 👉 Control CPU cores, hyperthreading, and process CPU usage on macOS. CPUSetter is a macOS utility that lets you control how your Mac's processor resources are used. It can enable or disable CPU cores and hyperthreading on supported processors, apply separate settings for battery and AC power, and limit the CPU usage of individual processes. CPUSetter also includes a process manager for adjusting process priority, viewing running applications, terminating processes, and monitoring system performance with built-in CPU, memory, disk, and network graphs. Administrator privileges are required for hardware-related changes, and a privileged helper tool is installed during first launch. Features: • Enable or disable physical and logical CPU cores • Enable or disable hyperthreading on supported processors • Apply separate CPU settings for battery and AC power • Limit the maximum CPU usage of individual processes • Change process priority (nice value) • Enable or disable throttling of low-priority processes • View and manage all running processes • Terminate running processes • Reveal process executables in Finder • Bring applications to the foreground • Display live CPU, memory, disk, and network performance graphs • Optionally apply saved settings automatically at system startup Supported operating systems: • macOS Big Sur 11.5 or higher Supported languages: English Changes: v1.7.1 12-16-25 • Requires macOS Big Sur (11.5) or later • Updated to Sparkle 2.7.0 • Fixed CPU sampling for hyperthreaded hosts In this screenshot, the Handbrake process has been limited to a maximum of 100% CPU usage (i.e. 1 whole core from the 4 available) and also reduced to a priority of 19. It is constrained as can be seen by it requesting more CPU resource than it is allowed to use. Click here to visit the author's website. |
|
3,538 | Jun 23, 2026 Bryan Christianson 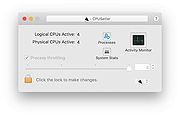 |
|
Fan Control v275 Fan Control v275 👉 Highly customizable fan control software for Windows. Fan Control is a focused and highly customizable fan controlling software for Windows that lets you control CPU, GPU, and case fans using temperature-based logic. It supports guided setup, multiple profiles, theme customization, multiple temperature sources, several fan curve functions including custom graphs, mixed fan curves and sensors using max, min, or average logic, low resource usage, and advanced tuning options such as steps, start and stop percentages, response time, and hysteresis. Features: • Guided setup process on first launch • Save, edit, and load multiple profiles • Change the theme and color of the application • Multiple temperature sources including CPU, GPU, motherboard, and hard drives • Multiple fan curve functions, including a custom graph • Mix fan curves or sensors together using max, min, or average • Low resource usage • Advanced tuning with steps, start %, stop %, response time, and hysteresis • Extensive support for CPU, GPU, case fans, and other hardware such as AIOs • Plugin support for adding third-party temperature, speed, or control sensors Fan curve types • Auto: PI-ish type function. % will surf until temp is stable at load. • Linear : Temperature based linear function • Graph : Temperature based custom curve • Target: Temperature based that holds speed until target temperature is reached • Mix : Use two different curves and apply a mix function (Min, Max, Sum, Average) • Sync : Sync to an existing control • Flat: Set a fixed % Graph fan curve editor • Change the temperature range for finer control ... |
|
7,183 | Aug 26, 2026 Rem0o 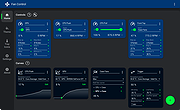 |
|
HWiNFO v8.54 HWiNFO v8.54 👉 Professional hardware information, real-time monitoring, and diagnostics for Windows and DOS systems. HWiNFO is a comprehensive hardware analysis, system information, diagnostics, and real-time monitoring utility designed for enthusiasts, technicians, and IT professionals. It provides detailed information about virtually every hardware component in your computer while continuously monitoring temperatures, voltages, fan speeds, power usage, clocks, storage health, and many other sensor values. HWiNFO also generates comprehensive hardware reports, supports extensive logging, and integrates with numerous third-party monitoring applications through its shared memory interface. Features: • In-depth hardware information with detailed analysis of system components • Real-time monitoring of CPUs, GPUs, mainboards, drives, and peripherals • System health monitoring designed to help detect overheating, overload, performance loss, or possible failure • Extensive reporting with full hardware hierarchy or quick summary overview • Export reports in XML, CSV, and HTML formats • Customizable monitoring tables, graphs, tray icons, and OSD • Customizable alerts on monitored parameters with user-defined actions • Support for interfacing with other applications and third-party extensions • Shared Memory interface support for exposing sensor data • Clean and secure design with no personal data collection and no network transmission • Frequently updated to support new hardware, technologies, and standards Supported operating systems: • Windows 95 and later (x86, x64 or ARM64) Supported languages: English, French, German, Spanish, Portuguese (Brazil), Italian, Dutch, Danish, Chinese (Simplified), Chinese (Traditional), Japanese, Korean, Vietnamese, Arabic, Russian, Ukrainian, Czech, Slovak, Hungarian, Polish, Swedish, Finnish, Norwegian, Greek, Turkish, Latvian, Hebrew Changes: v8.54 09-30-26 Added reporting of monitored process name to RTSS sensor title. Added workaround for NVML crash during GPU driver update. Fixed NZXT Kraken Elite V2 support. Fixed reporting of negative temperatures for NVIDIA GPU memory chips. Added ability to show multiple values on one line in OSD. Fixed reporting of PCH power on Intel Panther Lake and later. Added reporting of Fan Duty for Thermal Grizzly WireView Pro II. Added options to insert notes into json sensor log. Improved ... |
|
13,447 | Oct 02, 2026 REALiX 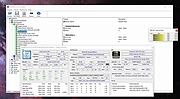 |
|
Novabench v6.0.3 Novabench v6.0.3 👉 Free PC benchmarking and hardware performance testing utility. Novabench is a free benchmarking program that allows you to quickly test and evaluate your computer’s overall performance. It measures CPU, GPU, RAM, and storage speeds using a simple interface designed for both casual users and technicians. The free version provides a complete system benchmark score along with detailed hardware information and comparison tools to help identify performance bottlenecks or hardware problems. Novabench can be useful for checking system stability after upgrades, comparing hardware performance against similar systems, troubleshooting slow computers, and monitoring the effects of overclocking or driver updates. Benchmark results can also be uploaded online to compare your PC with other systems using the Novabench database. Features: • Free CPU, GPU, RAM, and disk benchmarking • Generates an overall system performance score • Quick benchmark testing with minimal setup required • Displays detailed hardware and system information • Compare benchmark results with other systems online • Useful for testing gaming PCs, laptops, and workstations • Helps identify hardware bottlenecks and slow components • Portable benchmark results that can be shared online • Lightweight interface suitable for beginners and technicians • Supports stress testing and stability verification tools • Includes temperature and hardware monitoring support • Can help verify system improvements after upgrades or repairs Supported operating systems: • Windows 10, Windows 11 • macOS 11 Big Sur or higher • Linux distributions supporting modern x86-64 hardware Supported languages: • English Changes: v6.0.3 06-09-26 • Improved benchmark reliability and scoring consistency • Updated hardware detection and compatibility support • General bug fixes and stability improvements This download is for the Windows installer version (very bottom of page). All other download assets are below: Other Windows: novabench-arm64.exe macOS: novabench.dmg Linux: novabench-x64.deb novabench-arm64.deb novabench-x64.rpm novabench-arm64.rpm Click here to visit the author's website. |
|
7,802 | Jun 09, 2026 Novawave Inc. 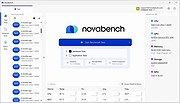 |
|
O&O DeskInfo v2.0.1033 O&O DeskInfo v2.0.1033 👉 Portable desktop system monitor that displays real-time hardware and network information directly on your desktop. O&O DeskInfo displays essential system information such as CPU usage, memory consumption, drive activity, network connections, battery status, and more directly on the Windows desktop in real time. The portable freeware utility allows users to monitor system activity without opening additional tools or menus. It also supports customizable layouts, colors, transparency, fonts, and multi-monitor positioning. O&O DeskInfo can quickly copy system details to the clipboard for troubleshooting and support purposes and includes warnings for unknown USB device connections. Features: • Real-time display of CPU, memory, drive, and network activity • Portable application with no installation required • Customizable desktop display position, colors, fonts, and transparency • Performance charts for CPU, memory, and network monitoring • Battery status display support for compatible systems • Detection of virtual machines • Profile editor with customizable columns and sortable categories • Clear distinction between local, removable, and network drives • Clipboard export for quick support and troubleshooting • Multi-monitor support • Warning notifications for unknown USB device connections • Adjustable update speeds and display modes • Tray icon integration with quick access functions • Automatic startup option with Windows Supported operating systems: • Windows 10 • Windows 11 Supported languages: • English, German, French Changes: v2.0.1033 01-28-26 • NEW: New performance charts for CPU, memory and network • NEW: Battery status display, if supported by the system • NEW: Detection of virtual machines • NEW: Greater flexibility in the profile editor with freely selectable columns and re-sortable categories • NEW: Improved customization options for the size of performance charts • NEW: Unified controls for a more consistent and clearer user interface • NEW: Extended documentation • NEW: Clearer distinction between local, removable and network drives • CHANGED: Performance charts react faster and more smoothly to display setting changes • CHANGED: Charts make better use of available space and appear overall clearer • CHANGED: Reduced visual duplication for a calmer display • ... |
|
3,674 | May 24, 2026 O&O Software GmbH 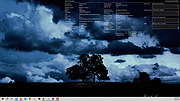 |
|
Process Governor v1.3.1 Process Governor v1.3.1 👉 Automate Windows process and service priority, I/O priority, and CPU affinity rules. Process Governor is a free Python-based Windows utility that automates the management of processes and services by applying user-defined rules for priority, I/O priority, and CPU core affinity. It can be used to fine-tune system responsiveness, control how selected programs use CPU cores, and automatically apply preferred settings to matching processes or services. Features: • Adjust process and service priorities • Control I/O priorities for better resource management • Set CPU core affinity for selected processes • Create rules for processes by name, path, or command line • Create rules for Windows services by service name • Supports wildcards in process and service rules • Optional force mode for continuous rule application • Optional delay before applying rules • View running process details including PID, executable path, service name, and command line • Search, sort, and filter process and service lists • System tray menu with access to settings, config file, log file, updates, startup option, and quit • Open file locations, file properties, and service properties from the process list • Undo, redo, hotkeys, and inline rule editing • Error highlighting for invalid rule entries • Optional auto-start with Windows Supported operating systems: • Windows 10 • Windows 11 Supported languages: English Changes: v1.3.1 04-19-25 Bug Fixes Fixed error messages: Resolved occasional error messages in the garbage collection process. Click here to visit the author's website. |
|
1,030 | Jun 15, 2026 System X - Files 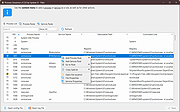 |
|
StressMyPC v5.88 StressMyPC v5.88 👉 Stress test your PC’s CPU, GPU and hard drive. StressMyPC is stress testing software used to put a Windows PC under heavy load for stability testing, battery drain testing or general hardware stress testing. It can stress the processor, graphics card and hard drive, and it is especially useful for seeing how a system behaves under full load. Features: • Start and stop PC stress testing quickly • Paint-Stress for simple GPU stress testing • Aggressive CPU-Stress for processor load testing • HD-Stress for hard drive stress testing • Useful for laptop battery drain testing • Portable, no installation required • Small program size • Multilingual interface Supported operating systems: • Windows 11, Windows 10, Windows 8.1, Windows 7, Windows Desktop and MS Server operating systems Supported languages: German, English, Swedish, Danish, Brazilian Portuguese, Slovak, Spanish, Simplified Chinese, French, Italian, Turkish, Czech, Russian, Ukrainian, Greek, Traditional Chinese, Romanian, Korean, Polish, Hungarian, Japanese, Thai, Arabic, Finnish, Frisian, Norwegian, Irish, Dutch, Portuguese, Vietnamese, Persian, Hindi, Hebrew, Spanish-VE, Malay, Indonesian, Filipino, Bosnian, Croatian, Serbian Changes: v5.88 05-13-26 Updated language files in the app for stress-testing Windows PCs, along with minor corrections in the stress-test app for Windows 11 that ensure a smoother PC stress test experience. Click here to visit the author's website. |
|
10,345 | May 17, 2026 SoftwareOK 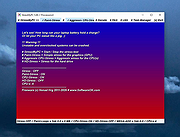 |
|
VIA Technologies Inc K8M400 CPU to PCI Bridge Chipset Driver Chipset Driver You must install the video driver (up one level) after installing this chipset driver. Manufacturer: VIA/S3G Model Name: VIA Technologies Inc K8M400 CPU to PCI Bridge Model Number: (Chipset)- K8M400 (Video Adapter)- K8M800/MMX/K3D Operating System: Windows XP |
 |
9,900 | Dec 01, 2012 VIA/S3G |
|
VIA Technologies Inc K8M400 CPU to PCI Bridge Video Driver You must download and install the chipset driver first. Go up one level. Manufacturer: VIA/S3G Model Name: VIA Technologies Inc K8M400 CPU to PCI Bridge Model Number: (Chipset)- K8M400 (Video Adapter)- K8M800/MMX/K3D Operating System: Windows XP |
|
9,599 | Dec 01, 2012 VIA/S3G |
|
Wagnardsoft CPU Benchmark v1.1.0.0 Wagnardsoft CPU Benchmark v1.1.0.0 A really simple tool for benchmarking and comparing CPUs. Mostly using integer for benchmarking. Requirement: -Windows 7 SP1+ -Microsoft .NET Desktop Runtime 5+ ChangeLog (1.1.0.0): -misc. bug fix -added timer / info about rime remaining in stress test mode -added tooltip with mouser over result for more information SHA1: 22E9FC1087D99637D48C649852CBD3457679357F Click here to visit the author's website. |
|
3,636 | Jun 07, 2021 Wagnardsoft 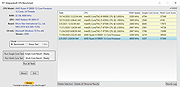 |
|
WhySoSlow Free Home Edition v1.61 WhySoSlow Free Home Edition v1.61 👉 Analyze system performance and identify why your computer is running slowly. WhySoSlow Free Home Edition is a diagnostic utility designed to help users quickly determine the causes of poor system performance. It analyzes your computer in real time and provides insights into issues such as CPU throttling, memory bottlenecks, disk performance problems, and other hardware or software limitations that may be slowing down your system. The program performs a series of checks and presents easy-to-understand results, making it useful for both casual users and more advanced troubleshooting scenarios. It helps pinpoint whether performance issues are caused by hardware limitations, thermal throttling, insufficient RAM, or background processes. Features: • Real-time system performance analysis • Detects CPU speed issues and throttling • Identifies memory and disk bottlenecks • Measures system responsiveness and load • Provides detailed system diagnostics and benchmarks • Helps pinpoint hardware or software causes of slowdowns • Simple interface with clear performance indicators Supported operating systems: • Windows 11, Windows 10 (x86 and x64), Windows 8.1 (x86 and x64), Windows 8 (x86 and x64), Windows 7 (x86 and x64) • Windows 2022 Server, Windows 2016 Server (x86 and x64), Windows 2012 Server (x86 and x64) Supported languages: English Changes: v1.61 10-22-20 Bug Fixed: "this version of WhySoSlow is not compatible with your operating system version" On certain systems, WhySoSlow could display a message "this version of WhySoSlow is not compatible with your operating system version". This has been fixed. Click here to visit the author's website. |
|
4,855 | Mar 24, 2026 Resplendence Software 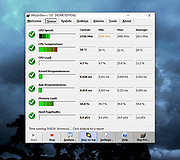 |
| Showing rows 1 to 18 of 18 | Showing Page 1 of 1 | 1 |
OlderGeeks.com Copyright (c) 2026
