|
|

|
Processed through Paypal No account required. |
Buy our over-priced crap to help pay the bills.


|
|
|
Processed through Paypal No account required. |
| File - Download Gnuplot v6.0.2 | ||||||||
| Description | ||||||||
|
A plea... Deanna and I have been running this site since 2008 and lately we're seeing a big increase in users (and cost) but a decline in percentage of users who donate. Our ad-free and junkware-free download site only works if everyone chips in to offset the revenue that ads on other sites bring in. Please donate at the bottom of the page. Every little bit helps. Thank you so much. Sincerely, your Older Geeks: Randy and Deanna Always scroll to the bottom of the page for the main download link. We don't believe in fake/misleading download buttons and tricks. The link is always in the same place. Gnuplot v6.0.2 A portable, multi-platform, command-line driven graphing utility. Gnuplot is a portable command-line driven graphing utility for Linux, OS/2, MS Windows, OSX, VMS, and many other platforms. The source code is copyrighted but freely distributed (i.e., you don't have to pay for it). It was originally created to allow scientists and students to visualize mathematical functions and data interactively, but has grown to support many non-interactive uses such as web scripting. It is also used as a plotting engine by third-party applications like Octave. Gnuplot has been supported and under active development since 1986. 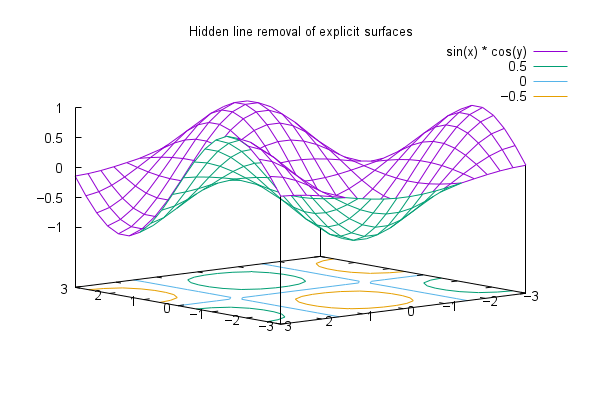 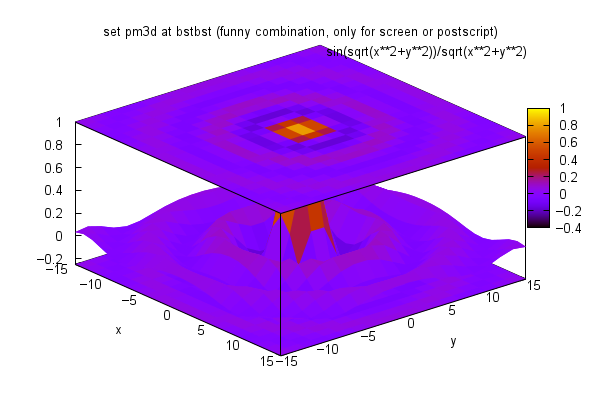 Gnuplot supports many different types of 2D and 3D plots. Here is a Gallery of demos. Gnuplot supports many different types of output • interactive screen display: cross-platform (Qt, wxWidgets, x11) or system-specific (MS Windows, OS/2) • direct output to file: postscript (including eps), pdf, png, gif, jpeg, LaTeX, metafont, emf, svg, ... • mouseable web display formats: HTML5, svg Changes: v6.0.2 * CHANGE Use of data source '-' inside a multiplot is an error; use a local datablock instead * CHANGE gd: scale "dot" (pointtype 0) by current linewidth Bug 2690 * FIX configure script modified to accommodate Fedora dependencies Bug 2706 * FIX mp: configure --with-metapost failed to include mp terminal * FIX empty field in csv file should not generate a tic label Bug 2667 2672 * FIX Do not autoscale or extend axis ranges while zooming Bug 2679 2680 * FIX svg: set default fill properties for depth-sorted pm3d objects * FIX x11: Empirical correction for bad rotation of enhanced text Bug 2661 * FIX wxt: Add exception handler for mouse event processing Bug 2680 2683 * FIX wxt: make right-mouse zoom box independent of terminal scaling Bug 2578 * FIX regression: border color of objects with fillstyle "empty" Bug 2686 * FIX "set colorbox border {<lt>}" parsing error * FIX gd x11: very short arrows were not drawn at all Bug 2690 * FIX qt wxt x11: "set term" from a script causes next pause to fail Bug 2703 * FIX tikz: fix use of palettes with a fixed number of colors Bug 2706 * FIX "stats ... name FOO" Do not delete existing variables FOO_* Bug 2695 * FIX order-dependent parsing of 2D plots with "fs solid fc variable" 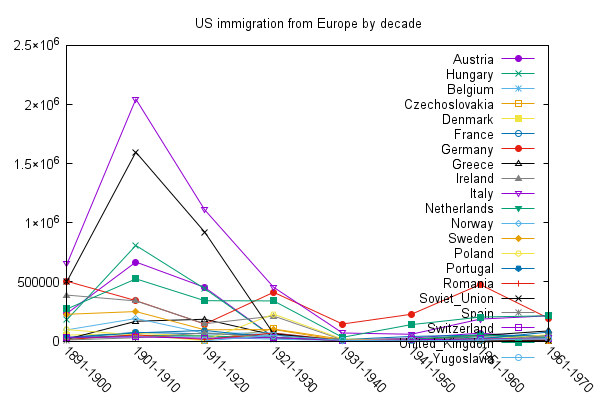 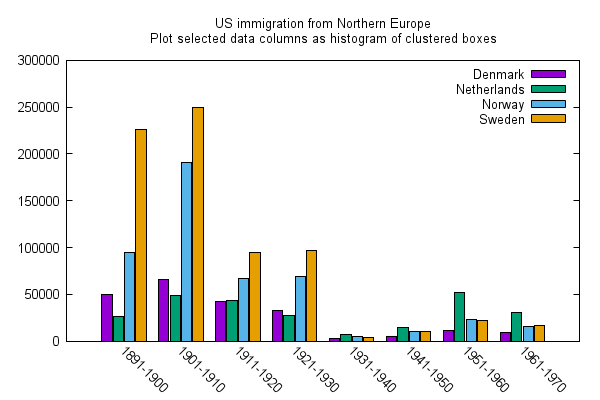 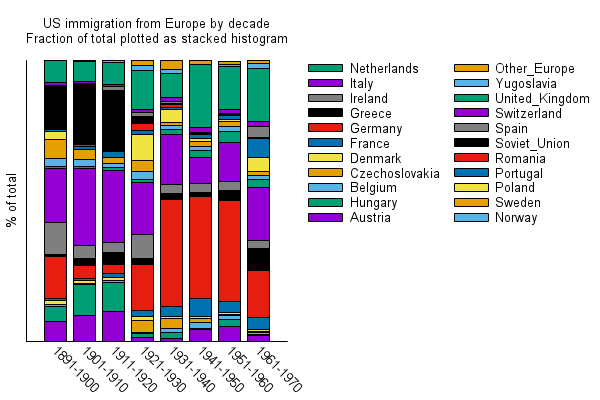 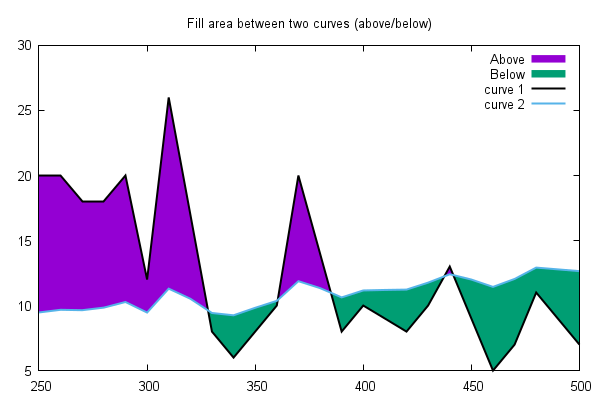 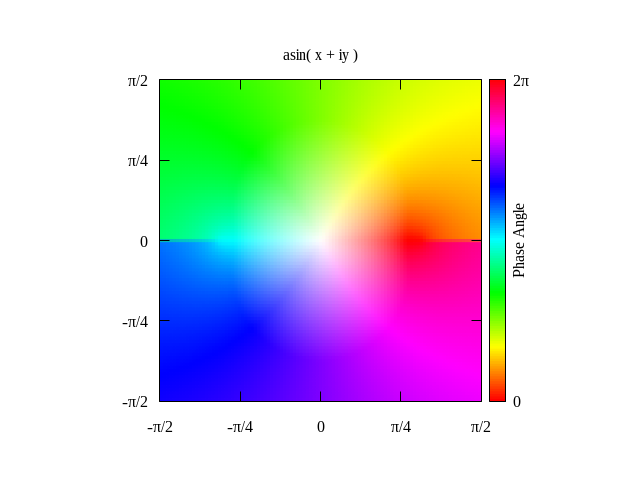 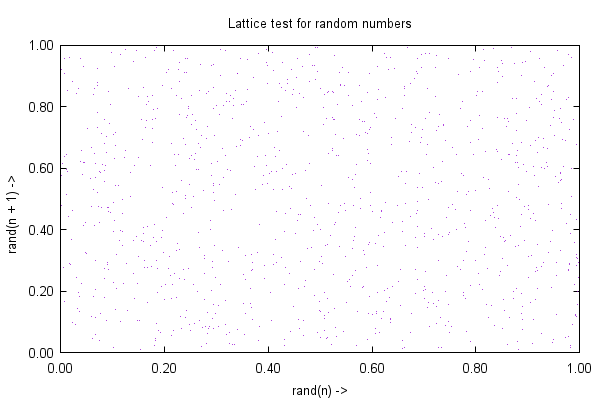 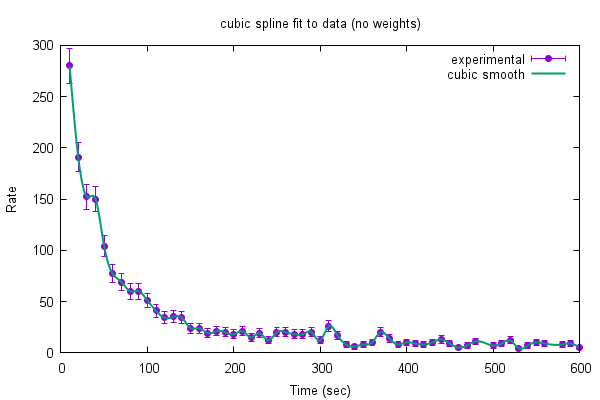 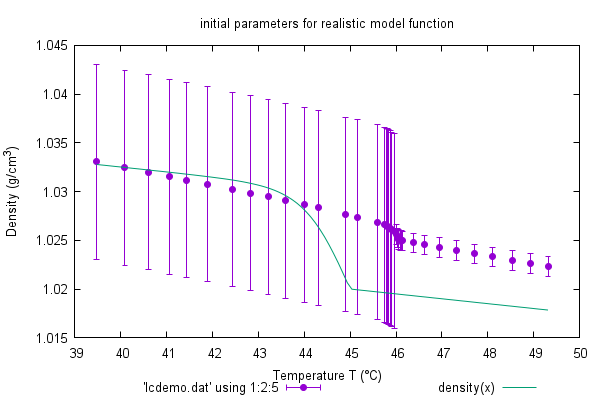  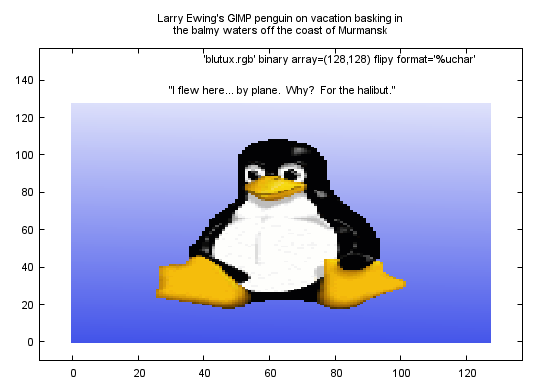   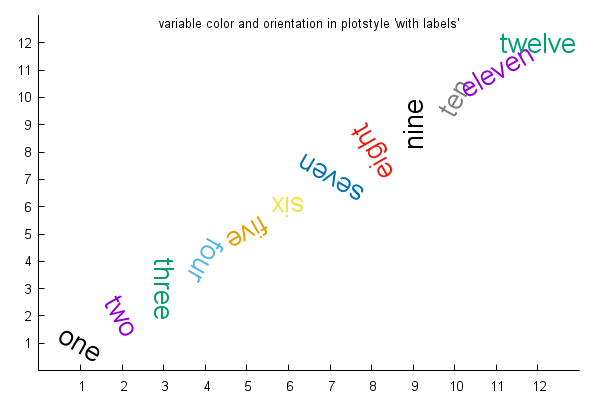 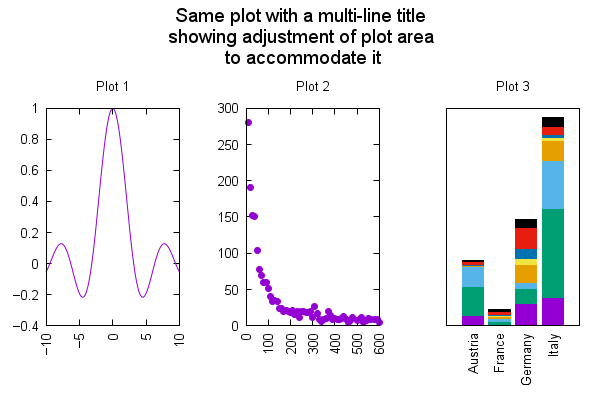 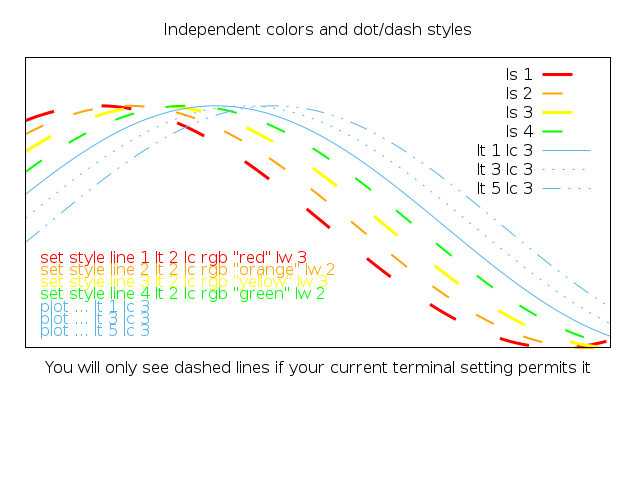 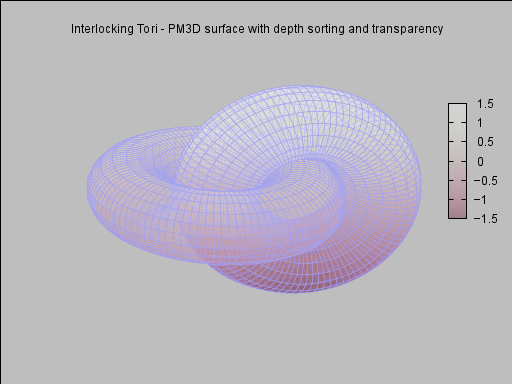 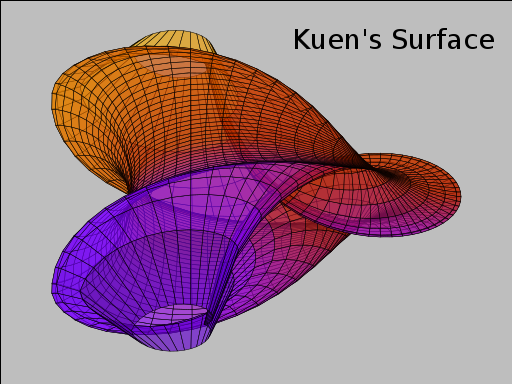 This download is for the Windows 64bit installer version (very bottom of page). All other download assets are below: Windows: Windows 64bit portable MacOS: Instructions for Mac. OS/2: gp545-os2-emx.zip Source: Source files for all operating systems Manuals: Gnuplot_5_4.pdf Gnuplot6.pdf Click here to visit the author's website. Continue below for the main download link. |
||||||||
| Downloads | Views | Developer | Last Update | Version | Size | Type | Rank | |
| 5,063 | 10,709 | Gnuplot Team | Feb 19, 2025 - 14:40 | 6.0.2 | 46.9MB | EXE |  , out of 76 Votes. , out of 76 Votes. |
|
| File Tags | ||||||||
| v6.0.2 Gnuplot | ||||||||
Click to Rate File Share it on Twitter → Tweet
|