|
|

Your download link is at the very bottom of the page... always. |
Processed through Paypal No account required. |
Buy our over-priced crap to help keep things running.


|
|
Your download link is at the very bottom of the page... always. |
Processed through Paypal No account required. |
| Files | ||||
| File Name | Rating | Downloads | ||
| Gnuplot v6.0.2 Gnuplot v6.0.2 A portable, multi-platform, command-line driven graphing utility. Gnuplot is a portable command-line driven graphing utility for Linux, OS/2, MS Windows, OSX, VMS, and many other platforms. The source code is copyrighted but freely distributed (i.e., you don't have to pay for it). It was originally created to allow scientists and students to visualize mathematical functions and data interactively, but has grown to support many non-interactive uses such as web scripting. It is also used as a plotting engine by third-party applications like Octave. Gnuplot has been supported and under active development since 1986. Gnuplot supports many different types of 2D and 3D plots. Here is a Gallery of demos. Gnuplot supports many different types of output • interactive screen display: cross-platform (Qt, wxWidgets, x11) or system-specific (MS Windows, OS/2) • direct output to file: postscript (including eps), pdf, png, gif, jpeg, LaTeX, metafont, emf, svg, ... • mouseable web display formats: HTML5, svg Changes: v6.0.2 * CHANGE Use of data source '-' inside a multiplot is an error; use a local datablock instead * CHANGE gd: scale "dot" (pointtype 0) by current linewidth Bug 2690 * FIX configure script modified to accommodate Fedora dependencies Bug 2706 * FIX mp: configure --with-metapost failed to include mp terminal * FIX empty field in csv file should not generate a tic label Bug 2667 2672 * FIX Do not autoscale or extend axis ranges while zooming Bug 2679 2680 * FIX svg: set default fill properties for depth-sorted pm3d objects * FIX x11: Empirical correction for bad rotation of enhanced text Bug 2661 * FIX wxt: Add exception handler for mouse event processing Bug 2680 2683 * FIX wxt: make right-mouse zoom box independent of terminal scaling Bug 2578 * FIX regression: border color of objects with fillstyle "empty" Bug 2686 * FIX "set colorbox border {<lt>}" parsing error * FIX gd x11: very short arrows ... |
 |
4,559 | Feb 19, 2025 Gnuplot Team 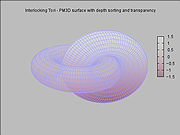 |
|
| Showing rows 1 to 1 of 1 | Showing Page 1 of 1 | 1 |
OlderGeeks.com Copyright (c) 2025
