|
Friture v0.49
Friture v0.49
A free, open source, real-time audio analyzer.
Features
The purpose of Friture is to help analyze an audio signal to understand the characteristics of this signal (fundamental, harmonics, feedback, etc.), to describe the source/room/receiver behaviour (reverberation, gain peaks, etc.), or to make adjustments in the preprocessing (room equalization). This is achieved by providing a set of widgets to visualize audio data:
2D Spectrogram widget
The 2D spectrogram widget displays audio data versus both frequency and time, in a rolling-against-time fashion. The time-frequency resolution of the display is fixed by the window length of the Fourier transform (as for the minimum response time of the spectrum widget). It is also limited by the resolution of your display in pixels.
Spectrum widget
The spectrum widget displays audio data versus frequency. This is very appropriate to visualize the characteristics of tha signal: fundamental frequency, harmonics, feedback frequencies, etc.
The response time of the display is configurable. The minimum response time is linked to the window length of the Fourier transform. For a FFT of 1024 points, and given the sampling rate of 48000 Hz used by Friture, the minimum response time is 1024/48000 = 21.3 ms.
Additionally, the widget draws peaks for each frequency component. These peaks mark the recent maxima of the spectrum, and start to decrease shortly after the peak was reached. Finally, a label identifies the frequency of the global maximum of the spectrum.
Octave Spectrum widget
The octave spectrum widget displays audio data versus time, similarly to the Spectrum widget. Audio data is grouped in frequency bins with fraction-of-octave widths. Each frequency bin is the result of a fraction-of-octave filter.
The following figure illustrates the frequency response of the filter bank used with the 3 bands-per-octave setting. The filters for each octave are applied after decimations of the signal. Both the band-pass filters and ... |
 |
999 |
Sep 26, 2023
Timothée Lecomte 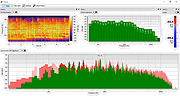 |