|

|
Processed through Paypal No account required. |








Buy our over-priced crap to help pay the bills.



|
|
Processed through Paypal No account required. |
| File - Download BlueScreenView v1.55 | ||||||||
| Description | ||||||||
|
Always scroll to the bottom of the page for the main download link. We don't believe in fake/misleading download buttons and tricks. The link is always in the same place. BlueScreenView v1.55 Displays BSOD (Blue Screen of Death) crash info. BlueScreenView scans all your minidump files created during 'blue screen of death' crashes, and displays the information about all crashes in one table. For each crash, BlueScreenView displays the minidump filename, the date/time of the crash, the basic crash information displayed in the blue screen (Bug Check Code and 4 parameters), and the details of the driver or module that possibly caused the crash (filename, product name, file description, and file version). For each crash displayed in the upper pane, you can view the details of the device drivers loaded during the crash in the lower pane. BlueScreenView also mark the drivers that their addresses found in the crash stack, so you can easily locate the suspected drivers that possibly caused the crash. 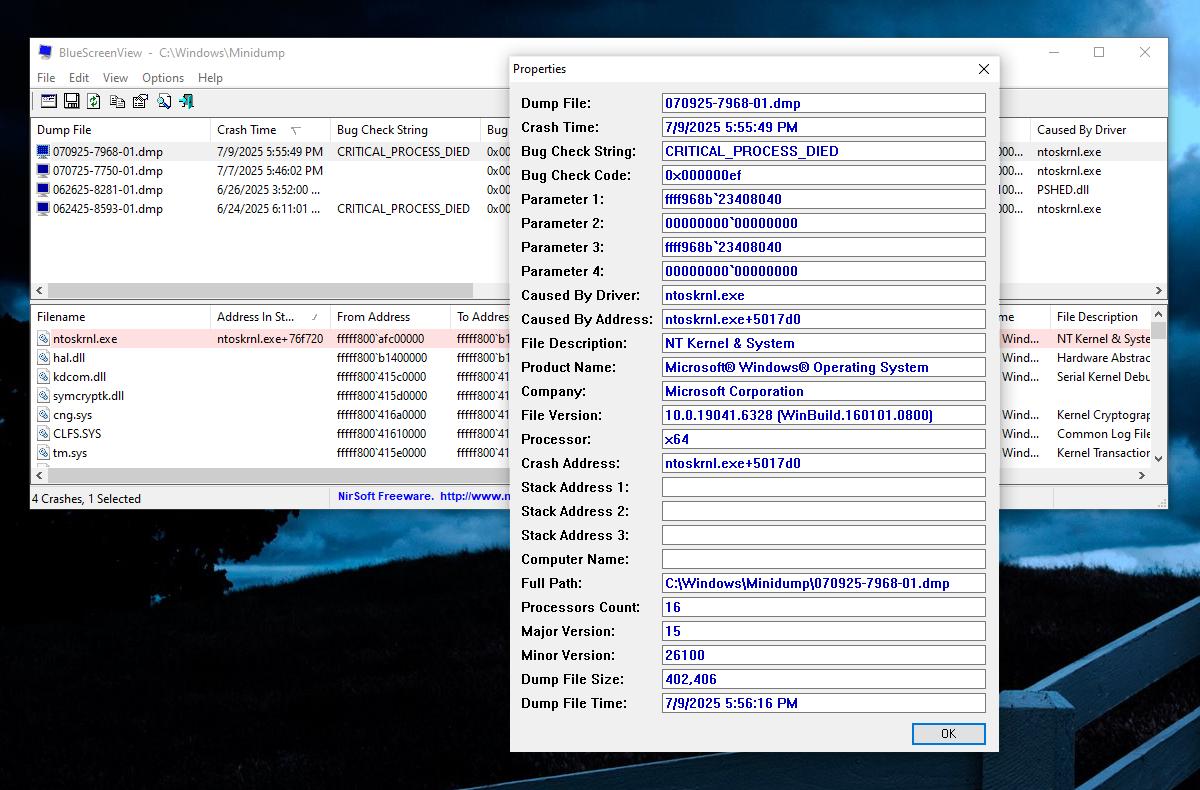 Supported operating systems: Windows XP, Server, Vista, 7, 8, 10, 11. Note: Windows must be configured to save minidump files during BSOD crashes. How to configure Windows to create MiniDump files on BSOD: Windows XP / Vista / 7 1) Right-click My Computer / Computer → Properties. 2) Go to the Advanced tab (XP) or Advanced system settings (Vista/7). 3) Under Startup and Recovery, click Settings. 4) In Write debugging information, choose Small memory dump (64 KB). 5) Default folder: C:\Windows\Minidump. 6) Click OK, then reboot if prompted. Windows 8 / 8.1 / 10 / 11 1) Right-click This PC → Properties (or open System from Control Panel). 2) Click Advanced system settings on the left. 3) In Startup and Recovery, click Settings. 4) In Write debugging information, select Small memory dump (256 KB). 5) Default folder: C:\Windows\Minidump. 6) Press OK and restart if necessary. Notes (all versions): • The option is sometimes called Small memory dump, minidump, or kernel memory dump (choose Small if you want files BlueScreenView can read easily). • Make sure the %SystemRoot%\Minidump folder exists and that the system has permission to write to it. • Dumps only generate if you’ve got a pagefile enabled on the system drive. • On servers, the UI is the same, but administrators often choose Kernel or Complete memory dumps instead of Small. Using BlueScreenView: BlueScreenView doesn't require any installation process or additional dll files. In order to start using it, simply run the executable file - BlueScreenView.exe After running BlueScreenView, it automatically scans your MiniDump folder and display all crash details in the upper pane. Crashes Information Columns (Upper Pane): • Dump File: The MiniDump filename that stores the crash data. • Crash Time: The created time of the MiniDump filename, which also matches to the date/time that the crash occurred. • Bug Check String: The crash error string. This error string is determined according to the Bug Check Code, and it's also displayed in the blue screen window of Windows. • Bug Check Code: The bug check code, as displayed in the blue screen window. • Parameter 1/2/3/4: The 4 crash parameters that are also displayed in the blue screen of death. • Caused By Driver: The driver that probably caused this crash. BlueScreenView tries to locate the right driver or module that caused the blue screen by looking inside the crash stack. However, be aware that the driver detection mechanism is not 100% accurate, and you should also look in the lower pane, that display all drivers/modules found in the stack. These drivers/modules are marked in pink color. • Caused By Address: Similar to 'Caused By Driver' column, but also display the relative address of the crash. • File Description: The file description of the driver that probably caused this crash. This information is loaded from the version resource of the driver. • Product Name: The product name of the driver that probably caused this crash. This information is loaded from the version resource of the driver. • Company: The company name of the driver that probably caused this crash. This information is loaded from the version resource of the driver. • File Version: The file version of the driver that probably caused this crash. This information is loaded from the version resource of the driver. • Crash Address:The memory address that the crash occurred. (The address in the EIP/RIP processor register) In some crashes, this value might be identical to 'Caused By Address' value, while in others, the crash address is different from the driver that caused the crash. • Stack Address 1 - 3: The last 3 addresses found in the call stack. Be aware that in some crashes, these values will be empty. Also, the stack addresses list is currently not supported for 64-bit crashes. Drivers Information Columns (Lower Pane): • Filename: The driver/module filename • Address In Stack: The memory address of this driver that was found in the stack. • From Address: First memory address of this driver. • To Address: Last memory address of this driver. • Size: Driver size in memory. • Time Stamp: Time stamp of this driver. • Time String: Time stamp of this driver, displayed in date/time format. • Product Name: Product name of this driver, loaded from the version resource of the driver. • File Description: File description of this driver, loaded from the version resource of the driver. • File Version: File version of this driver, loaded from the version resource of the driver. • Company: Company name of this driver, loaded from the version resource of the driver. • Full Path: Full path of the driver filename. Lower Pane Modes: Currently, the lower pane has 4 different display modes. You can change the display mode of the lower pane from Options->Lower Pane Mode menu. • All Drivers: Displays all the drivers that were loaded during the crash that you selected in the upper pane. The drivers/module that their memory addresses found in the stack, are marked in pink color. • Only Drivers Found In Stack: Displays only the modules/drivers that their memory addresses found in the stack of the crash. There is very high chance that one of the drivers in this list is the one that caused the crash. • Blue Screen in XP Style: Displays a blue screen that looks very similar to the one that Windows displayed during the crash. • DumpChk Output: Displays the output of Microsoft DumpChk utility. This mode only works when Microsoft DumpChk is installed on your computer and BlueScreenView is configured to run it from the right folder (In the Advanced Options window). You can get DumpChk from the installation CD/DVD of Windows or with the installation of Debugging Tools for Windows. Crashes of Remote Network Computer: If you have multiple computers on your network and you have full administrator access to them (e.g: you have access to \\ComputerName\c$), you can also view the crashes of the other computers on your network remotely. In order to do that, simply go to 'Advanced Options' (Ctrl+O) and type the MiniDump folder of the remote computer, for example: \\MyComp\c$\Windows\MiniDump. Watching the crashes of multiple computers on your network: If you have a network with multiple computers, and you have full admin access to these computers, you can view the blue screens list of all these computers in one table, and easily detect computers with recurring BSOD problems. In order to use this feature, prepare a list of all computer names/IP addresses that you want to inspect, and save it to a simple text file. The computer names in the list can be delimited by comma, semicolon, tab character, or Enter (CRLF). Example for computer names list: comp01After you have a text file contains the computers list, you can go to Advanced Options window (Ctrl+O), choose the second option and type the computers list filename. License: This utility is released as freeware. You are allowed to freely distribute this utility via floppy disk, CD-ROM, Internet, or in any other way, as long as you don't charge anything for this. If you distribute this utility, you must include all files in the distribution package, without any modification. Disclaimer: The software is provided "AS IS" without any warranty, either expressed or implied, including, but not limited to, the implied warranties of merchantability and fitness for a particular purpose. The author will not be liable for any special, incidental, consequential or indirect damages due to loss of data or any other reason. Feedback: If you have any problem, suggestion, comment, or you found a bug in this utility, you can send a message to nirsofer@yahoo.com This download is for the Windows 64bit version (very bottom of page). If you need the Windows 32bit version, download here. Click here to visit the author's website. Continue below for the main download link. |
||||||||
| Downloads | Views | Developer | Last Update | Version | Size | Type | Rank | |
| 6,353 | 16,568 | Nir Sofer | Oct 26, 2025 - 16:04 | 1.55 | 83.4KB | ZIP |  , out of 81 Votes. , out of 81 Votes. |
|
| File Tags | ||||||||
| BlueScreenView v1.55 | ||||||||
Click to Rate File Share it on Twitter → Tweet
|