|

|
Processed through Paypal No account required. |








Buy our over-priced crap to help pay the bills.



|
|
Processed through Paypal No account required. |
| File - Download Social Network Visualizer v3.6 | ||||||||
| Description | ||||||||
|
Always scroll to the bottom of the page for the main download link. We don't believe in fake/misleading download buttons and tricks. The link is always in the same place. Social Network Visualizer v3.6 👉 Analyze, visualize, and study social network structures and relationships. Social Network Visualizer is an open-source software tool for the analysis and visualization of social networks. It allows researchers, students, and analysts to examine relationships between individuals, organizations, or other entities by modeling them as networks of nodes and connections. The program includes multiple layout algorithms and analytical measures that help reveal patterns, clusters, and influential actors within a network. Social Network Visualizer supports importing networks from several popular formats and provides tools for creating networks manually or generating them through various models. Users can explore network metrics, visualize connections using customizable layouts, and export results for further research or presentation. 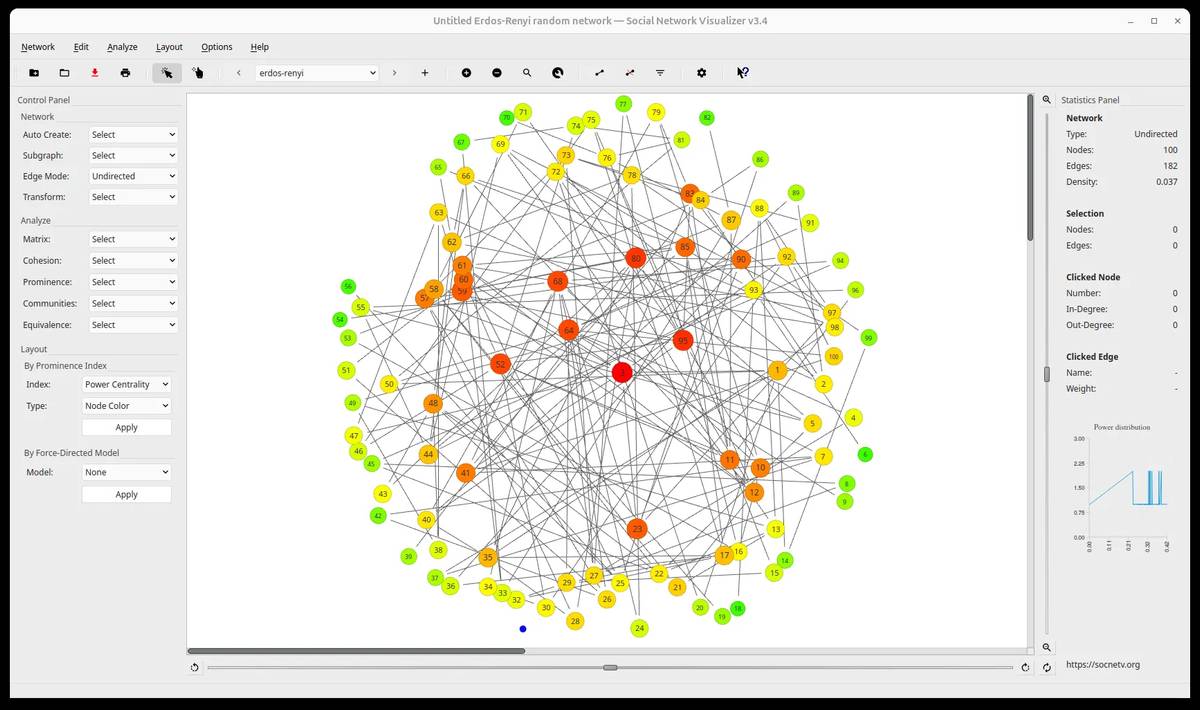 Features: • Visualize networks using multiple layout algorithms • Calculate network metrics such as centrality, cohesion, and clustering • Import and export networks in common formats (GraphML, Pajek, UCINET, and more) • Generate networks using built-in random graph models • Interactive graph editing and manual network creation • Customizable node and edge visualization styles • Community detection and network analysis tools • Export graphs and results for reports and presentations Supported operating systems: • Windows 7, Windows 8, Windows 10, Windows 11 • macOS • Linux Supported languages: English, Greek Changes: v3.6 05-26-26 This release adds a multi-condition Query Builder filter, subgraph extraction, four new export formats (UCINET DL, GraphViz DOT, weighted and simple edge lists), connected-component colouring, Clustering Coefficient node colouring, and working Bezier curve edges. Analysis of large networks is also noticeably faster — read on for details. Query Builder — multi-condition filtering A new Filter → Filter by Query… action opens the Query Builder dialog. You can add as many conditions as you like (pick an attribute, an operator, and a value), and only nodes or edges matching all of them will be shown. It works alongside the existing Filter Bar — the result appears as a removable chip, just like any other filter. Subgraph Extraction A new Edit → Subgraphs submenu lets you save a piece of your network as a separate file: Save visible nodes as subgraph… — saves whatever is currently visible on the canvas (after filters) as an independent network file. Save selected nodes as subgraph… — same, but only for selected nodes. Your original network is never modified. Four New Export Formats You can now export your network to four additional formats: UCINET DL — compatible with UCINET and other tools that read the DL format. Multi-relation networks are fully supported. GraphViz DOT — exports node positions, colours, shapes, and custom attributes. You can reload the exported file back into SocNetV and get exactly the same network. Weighted Edge List — a simple text file with one source target weight per line. Simple Edge List — same, without the weights. The Save Subgraph As… dialog now also offers all these formats (previously it was limited to GraphML, Pajek, and Adjacency). Connected-Component Colouring A new Layout → Node Color by Connected Component action colours each node according to its connected component — nodes in the same component share the same colour. This makes it immediately obvious when your network is split into disconnected parts. The Analyze → Cohesion → Connectedness report now also tells you how many components the network has. Clustering Coefficient Node Colouring Layout → Node Color → Clustering Coefficient colours nodes by their local clustering coefficient using the same blue-to-red gradient used by all other centrality measures. It is also available in the Filter Nodes by Centrality dialog and the distribution chart. Bezier Curve Edges — now actually working The Options → Edges → Bezier Curves toggle has been in the menu since v3.4 but never did anything. It is now fully working: edges draw as smooth curves, arrowheads point in the right direction even on reciprocated pairs, and the setting is remembered across sessions. Zero-weight Edge Settings A new Settings → Edges → Show zero-weight edges checkbox (on by default) lets you hide zero-weight edges on load — useful when your data file contains them but you don’t want them cluttering the canvas. The zero-weight edge colour picker in Settings now actually works (it was wired up in the UI but had no effect before). Configurable Arrow Size A new Settings → Edges → Arrow size control lets you make arrowheads bigger or smaller. The change applies immediately to all edges and is remembered for future sessions. Faster analysis on large networks All centrality and distance computations (betweenness, closeness, eccentricity, and others) now use all available CPU cores instead of just one. The numbers below are from our tests on a 12-core Linux machine: Network Centralities computed Before After Directed, 500 nodes, 1 219 edges yes 679 ms 255 ms 1 000 nodes, 10 000 edges no 28 423 ms 3 431 ms 1 000 nodes, 10 000 edges yes 47 020 ms 5 949 ms Large networks (2 000+ nodes, 40 000+ edges) are also smoother to navigate — selecting, dragging, and rubber-band selection no longer slow to a crawl. Other Improvements The Layout section of the Control Panel no longer has “Apply” buttons — layout changes take effect as soon as you make a selection. The Statistics Panel on the right is now divided into collapsible sections, so you can hide the parts you don’t need. Node and edge toolbar actions now behave sensibly when multiple items are selected: one item selected opens its properties dialog, multiple selected opens a bulk-edit dialog. The left Control Panel now scrolls when vertical space is tight (e.g. when the Data Table dock is open) instead of overlapping its own widgets. The status bar now shows a “Computing… please wait” message whenever the app is doing something that takes a moment, so you always know it is working. Notable Bug Fixes UCINET DL two-mode networks now load correctly (node counts, node numbers, and labels were all wrong before). Galaskiewicz famous network now loads correctly — a missing data file in the app bundle was causing it to silently fail. Edge mode (directed/undirected) now correctly switches back when you change relation — each relation remembers its own setting. Zero-weight edges were being counted in several analyses where they shouldn’t have been (density, reciprocity, clustering coefficient, shortest paths). All fixed. Shift+click on a node now adds it to the current selection instead of replacing it. GraphViz DOT files exported by SocNetV could silently drop the first node when reloaded, producing wrong edges. Fixed. Multi-relation networks where the first relation had no weights but a later one did were incorrectly reported as unweighted throughout the app. Fixed. Several keyboard shortcut conflicts between actions were resolved. 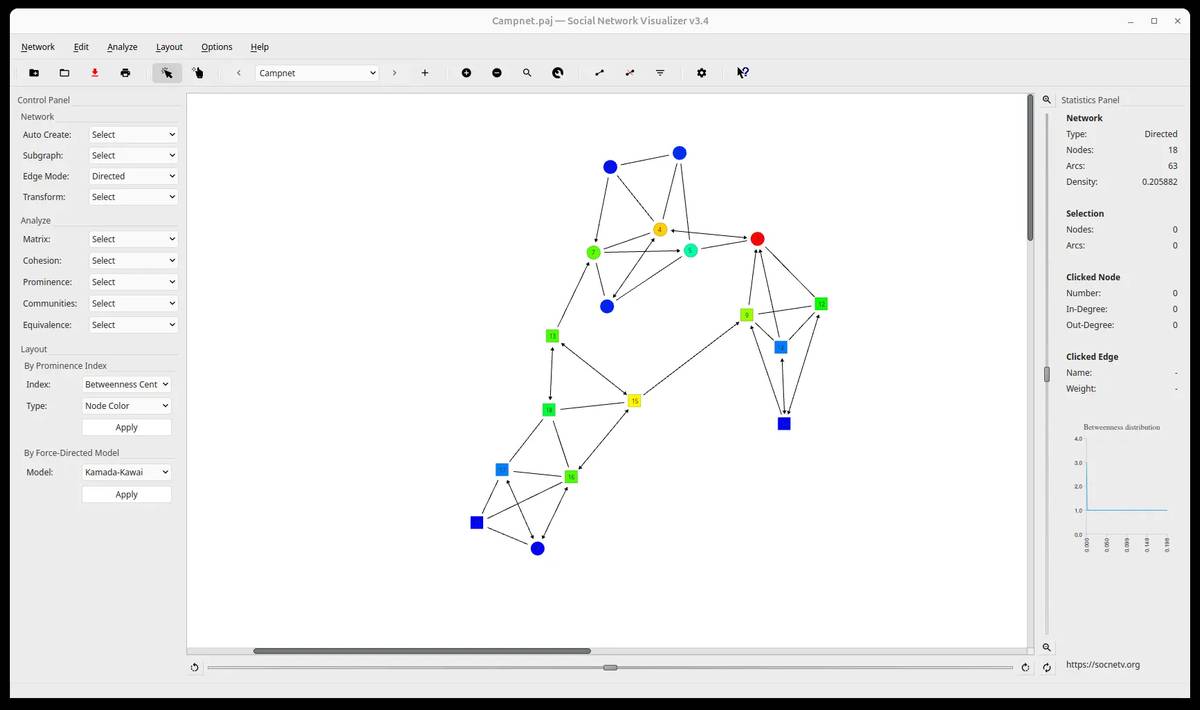 This download is for the Windows version (very bottom of page). All other download assets are below: macOS: SocNetV-3.6.dmg Linux: SocNetV-3.6-x86_64.AppImage Click here to visit the author's website. Continue below for the main download link. |
||||||||
| Downloads | Views | Developer | Last Update | Version | Size | Type | Rank | |
| 6,685 | 16,447 | Dimitris V. Kalamaras | Jul 20, 2026 - 12:29 | 3.6 | 45.59MB | EXE |  , out of 98 Votes. , out of 98 Votes. |
|
| File Tags | ||||||||
| Visualizer analysis visualization graph analysis sociology research tool open source analysis tool | ||||||||
Click to Rate File Share it on Twitter → Tweet
|