|

|
Processed through Paypal No account required. |








Buy our over-priced crap to help pay the bills.



|
|
Processed through Paypal No account required. |
| Files | ||||
| File Name | Rating | Downloads | ||
 |
AllThreadsView v1.00 AllThreadsView v1.00 👉 View all running Windows threads from every process in one table. AllThreadsView is a lightweight portable utility from NirSoft that displays every running thread from every active process on your Windows computer in a single, continuously updated list. Instead of examining one process at a time, you can instantly see detailed information for all system and application threads, making it much easier to troubleshoot performance problems, investigate application behavior, or inspect low-level process activity. Features: • Displays all running threads from every active process • Shows Thread ID, Process ID, Process Name and Process Path • Displays thread creation time, duration, kernel time and user time • Shows thread priority, base priority and wait reason • Displays the thread start address • Automatically refreshes the thread list • Option to display only active threads • Export selected or all items to TXT, CSV, HTML, XML and JSON • Portable application requiring no installation Supported operating systems: • Windows XP, Windows Vista, Windows 7, Windows 8, Windows 10 • Windows 11 • 32-bit and 64-bit editions Supported languages: English, Arabic, Basque, Bulgarian, Catalan, Czech, Danish, Dutch, Finnish, French, German, Greek, Hungarian, Italian, Japanese, Korean, Persian, Polish, Portuguese, Portuguese (Brazil), Romanian, Russian, Simplified Chinese, Slovak, Slovenian, Spanish, Swedish, Traditional Chinese, Turkish, Ukrainian Changes: v1.00 06-28-26 • First release. This download is for the Windows 64bit version (very bottom of page). If you need the Windows 32bit version, download here. Click here to visit the author's website. |
 |
4,620 | Jun 29, 2026 Nir Sofer 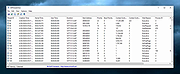 |
|
DebugView v5.02 DebugView v5.02 👉 Monitor local and remote Windows debug output in real time. DebugView is a Sysinternals utility that captures and displays both Win32 and kernel-mode debug output from your local system or from remote computers you can reach over TCP/IP. It is designed for developers, administrators, and troubleshooters who want to view debug messages without attaching a traditional debugger. DebugView can also recover kernel-mode debug output from crash dump files when it was capturing at the time of the crash, and it includes tools for filtering, logging, searching, printing, and managing captured output. Features: • Captures Win32 OutputDebugString output • Captures kernel-mode DbgPrint output • Captures all kernel-mode DbgPrint variants implemented in Windows and Windows Server • Monitors debug output from local or remote computers over TCP/IP • Supports simultaneous monitoring of multiple remote systems • Recovers kernel-mode debug output from crash dump files when capture was active • Includes filtering and highlighting options for debug output • Lets you toggle display of process IDs for Win32 debug output • Copies selected output lines to the clipboard • Logs captured debug output to a file • Loads saved log files back into the output window • Prints all or part of captured output • Runs as a single executable file • Requires administrative privileges to view kernel-mode debug output Supported operating systems: • Windows Vista, Windows 7, Windows 8, Windows 10, Windows 11, Server Supported languages: English Changes: v5.02 06-17-26 Command-line interface (DbgViewCLI): A new standalone command-line tool (dbgviewcli.exe) provides full debug capture capabilities from the terminal. Designed for scripted, automated, and AI-agent-driven workflows with bounded execution, machine-readable output, and process-specific filtering. See the DbgViewCLI section below for full details. AI-agent automation parameters: New CLI options (--duration, --max-lines, --wait-for, --tail, --no-banner, --status, --pid-filter, --process-filter) guarantee bounded execution and clean output for programmatic use by coding agents. Embedded agent skills with one-command install: DbgViewCLI embeds agent skill files as a binary resource and can ... |
|
746 | Aug 04, 2026 Microsoft Corp. 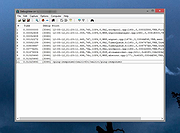 |
|
Live Kernel Memory Dump v1.0 Live Kernel Memory Dump v1.0 Live Kernel Memory Dump (LKMD) is an advanced Windows console utility that allows you to dump “live” kernel memory without having to force the system down (like you would with a bugcheck issued). No active kernel debug session is required which you normally would have in a debugger/debugee relationship. All kernel mode memory regions are dumped in a stable manner due to the underlying technology used in this utility which Windows uses itself to generate crash dump reports and is therefore reliable and stability isn't compromised even when memory is captured in a live system environment. For Windows 8.1, 10 (32\64-bit) Output is in proper dump format The resultant memory dump file is output in proper dump file format so viewing the details is as simple as loading the generated dump file within modern crash dump analysis tools such as WinDbg (e.g: WinDbg v10.0.16299.15) Multiple flags can optionally be specified during dump report generation, such as (Hypervisor Page inclusion, Compression of Page Data, Usermode Memory inclusion, etc.). LKMD is compatible with Windows 8.1 and newer (Windows 10). Whether you're into digital forensics or you are an Admin diagnosing a system infection this tool will come in handy and is recommended for advanced users only. Works on Live Systems No "active" kernel debug session is required to generate memory dump. Stable by Design Due to using Windows own Crash Dump API to generate output file. Multiple Dump Option Flags May optionally be used to influence the memory capturing process. Proper Dump File Format Support for modern versions of crash dump analysis tools (WinDbg v10.0 et al). Dump Kernel Mode Memory All kernel mode memory regions are properly dumped to disk file. Dump Usermode Memory Using optional flags you can include also usermode memory regions. Win 8.1 & Win 10 Compatible ... |
|
6,120 | Mar 15, 2019 NoVirusThanks 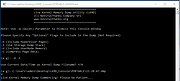 |
| Showing rows 1 to 3 of 3 | Showing Page 1 of 1 | 1 |
OlderGeeks.com Copyright (c) 2026
