|
Live Kernel Memory Dump v1.0
Live Kernel Memory Dump v1.0
Live Kernel Memory Dump (LKMD) is an advanced Windows console utility that allows you to dump “live” kernel memory without having to force the system down (like you would with a bugcheck issued). No active kernel debug session is required which you normally would have in a debugger/debugee relationship. All kernel mode memory regions are dumped in a stable manner due to the underlying technology used in this utility which Windows uses itself to generate crash dump reports and is therefore reliable and stability isn't compromised even when memory is captured in a live system environment.
For Windows 8.1, 10 (32\64-bit)
Output is in proper dump format
The resultant memory dump file is output in proper dump file format so viewing the details is as simple as loading the generated dump file within modern crash dump analysis tools such as WinDbg (e.g: WinDbg v10.0.16299.15) Multiple flags can optionally be specified during dump report generation, such as (Hypervisor Page inclusion, Compression of Page Data, Usermode Memory inclusion, etc.). LKMD is compatible with Windows 8.1 and newer (Windows 10). Whether you're into digital forensics or you are an Admin diagnosing a system infection this tool will come in handy and is recommended for advanced users only.
Works on Live Systems
No "active" kernel debug session is required to generate memory dump.
Stable by Design
Due to using Windows own Crash Dump API to generate output file.
Multiple Dump Option Flags
May optionally be used to influence the memory capturing process.
Proper Dump File Format
Support for modern versions of crash dump analysis tools (WinDbg v10.0 et al).
Dump Kernel Mode Memory
All kernel mode memory regions are properly dumped to disk file.
Dump Usermode Memory
Using optional flags you can include also usermode memory regions.
Win 8.1 & Win 10
Compatible ... |
 |
4,837 |
Mar 15, 2019
NoVirusThanks 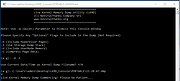 |
|
Memory Checker v1.2.3
Memory Checker v1.2.3
A simple memory stress-testing tool. It is useful to test the reliability of your computer's main memory (RAM) under “high” load.
Because the Memory Checker runs as a “normal” Windows application, it is very easy to use. See the limitations below.
Disclaimer
Memory Checker puts a high stress on your computer's hardware and thus may trigger hardware problems that otherwise would have remained unnoticed.
Be patient when running this tool. Your computer may appear to be frozen but it is not.
It is possible that this will cause your system to crash. In extremely rare circumstances even permanent damage or data loss is possible!
In no event will the authors of this program be liable to you for damages, including any general, special, incidental or consequential damages arising out of the use or inability to use the program; including but not limited to loss of data or data being rendered inaccurate or losses sustained by you or third parties or a failure of the program to operate with any other programs.
By running this program on your machine, you acknowledge and agree that the use of this program is at your own risk.
Synopsis
The Memory Checker program is invoked as follows:
MemoryChecker.exe [OPTIONS] [<target_memory_size>[%]] [<threads>]
Specifying the amount of memory to be tested and the number of threads to be used is optional. If not specified explicitly, default values apply.
The amount of memory to be tested can be specified as a percentage of the total physical memory.
Note: Its is highly recommended to close all other programs that are running on your machine before the Memory Checker tool is launched.
Options
The following command-line options are available:
--batch:
Exit the program immediately (i.e. do not wait for a key press) when the test has completed or failed.
--continuous:
... |
|
2,200 |
Feb 12, 2023
LoRd_MuldeR 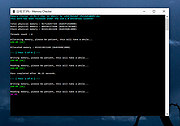 |
|
My Memory Monitor v1.70
My Memory Monitor v1.70
My Memory Monitor shows physical memory usage in real time in the systray area and on screen.
You can also view the top processes which use the most ram by right clicking on the window or on systray icon.
Version 1.70:
updated internal libraries code
- some bugfix
|
|
5,356 |
Apr 08, 2016
My Portable Software 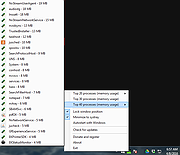 |